The financials overall have lagged somewhat, with the XLF on a 3 and 6 month basis just the 10th and 9th best of the 11 major S&P sectors. The group has shown some lukewarm recent firmness, and if one were to be putting together a watch list, they want to highlight names that have shown excellent relative strength throughout. Below is a prime example of LPLA, and how it was profiled in our 1/23 Financial Report. The second chart shows how it is setting up after its recent earnings report.
- Investment services play higher by 13% YTD and 17% over last one year period. Dividend yield of 1.4%.
- 4 week winning streak higher by more than combined 20%, beginning with bullish engulfing week ending 12/28/18.
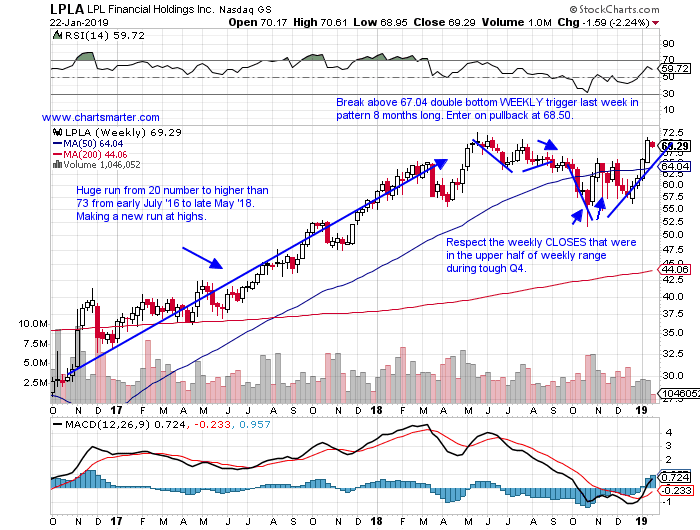
- Solid relative strength just 6% off most recent all time highs. Week ending 7/8/16 bounced off round 20 number and traveled to 73 last May. Good digestion last 7 months.
- Break above 67.04 double bottom WEEKLY trigger last week. Enter on pullback at 68.50.
- Trigger LPLA 68.50. Stop 64. (REPORTS 1/31 after close).
- Taking a present look at the stock 3 of last 5 weeks rose in 7% neighborhood.
- Strong relative strength advancing 2.1% last week while XLF fell 1.5%.
- Just 2% off all time highs, while peers SF and RJF trade in bear market mode down 21 and 23% from their respective highs.
- Spinning top on WEEKLY chart last week could provide a pullback for entry near 75. Stop 69.
If you liked what you read why not take a 2 week FREE trial at www.chartsmarter.com.
The financials overall have lagged somewhat, with the XLF on a 3 and 6 month basis just the 10th and 9th best of the 11 major S&P sectors. The group has shown some lukewarm recent firmness, and if one were to be putting together a watch list, they want to highlight names that have shown excellent relative strength throughout. Below is a prime example of LPLA, and how it was profiled in our 1/23 Financial Report. The second chart shows how it is setting up after its recent earnings report.
- Investment services play higher by 13% YTD and 17% over last one year period. Dividend yield of 1.4%.
- 4 week winning streak higher by more than combined 20%, beginning with bullish engulfing week ending 12/28/18.
- Solid relative strength just 6% off most recent all time highs. Week ending 7/8/16 bounced off round 20 number and traveled to 73 last May. Good digestion last 7 months.
- Break above 67.04 double bottom WEEKLY trigger last week. Enter on pullback at 68.50.
- Trigger LPLA 68.50. Stop 64. (REPORTS 1/31 after close).
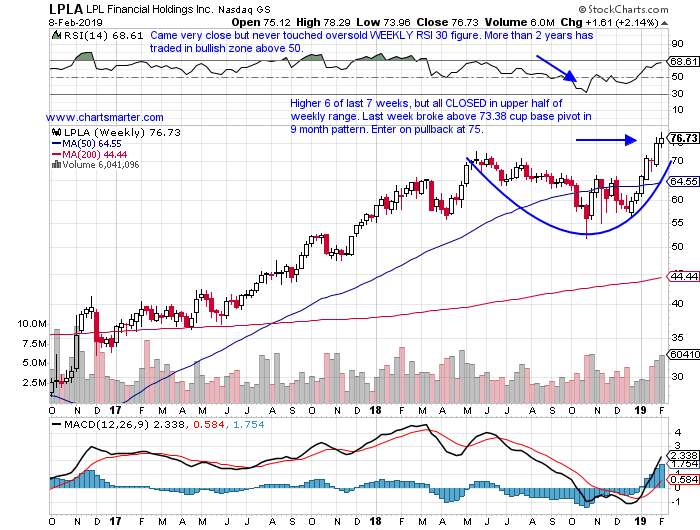
- Taking a present look at the stock 3 of last 5 weeks rose in 7% neighborhood.
- Strong relative strength advancing 2.1% last week while XLF fell 1.5%.
- Just 2% off all time highs, while peers SF and RJF trade in bear market mode down 21 and 23% from their respective highs.
- Spinning top on WEEKLY chart last week could provide a pullback for entry near 75. Stop 69.
If you liked what you read why not take a 2 week FREE trial at www.chartsmarter.com.