"Do not confuse brains with a bull market."
Good Habits:
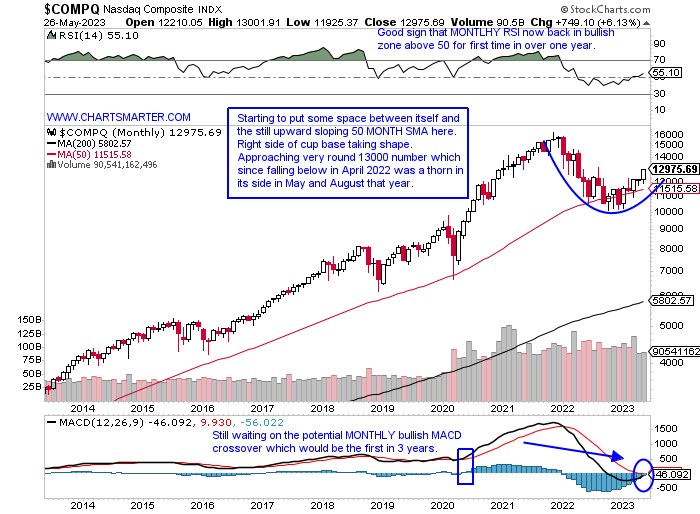
- We know it is a bit premature with 2 sessions, as the debt ceiling debate comes to a conclusion, left in May but below we take a look at the MONTHLY chart of the Nasdaq and if it CLOSES in this 13000 area, it will make it 4 of the last 5 months CLOSING at highs for the MONTHLY range. Good habits are hard to break and perhaps this will be a good sign as we head into the solid seasonality period, and remember we spoke a few weeks back about how April having the tightest MONTHLY range in the last 4 years was a very bullish development. If it can climb above the 13000 number which was a speed bump last May and August that would in my opinion really put some FOMO into this rally. Over the last month's period, the semiconductors rose more than 26%, not a typo, and software is also higher by more than double digits. MRVL during that period has jumped 72% and peer PLAB has added more than 50% falling just 5 sessions during the time frame. In software AI and PLTR have advanced 86 and 76% respectively. And plenty still do not believe in this potent, overall move.
Bonds Bottoming?
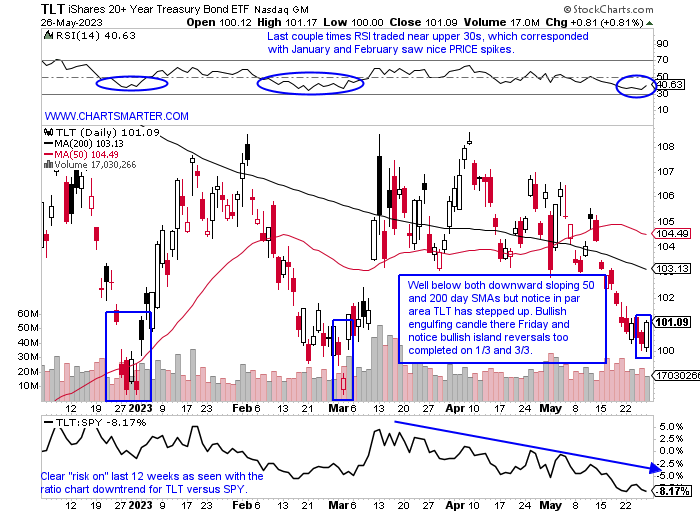
- Market participants often like to gauge risk appetite by comparing the TLT to the SPY. That can be seen at the bottom of the PRICE chart below which does show the TLT in a steep downtrend since mid-March. Bears may interpret this as the major averages in need of at least a rest and maybe more. As a fan of round number theory notice how the TLT recorded a bullish engulfing candle Friday precisely at par. Since the TLT registered a bullish WEEKLY piercing line candle the week ending 10/28/22 up 4% it has defended the 100 figure well. To me, this is a trading vehicle and a bounce most likely a dead cat in nature looks plausible here. That should give equities a chance for a well-deserved breather. The SPY is watching this, and rates themselves rose meaningfully last week with the 10-year yield up more than 3% last week after the prior week rose almost 7%. Bonds may be ready for some time in the sun.
Gauging Sentiment:
- I know many frown upon the idea of doing technical analysis on the VIX, but anything in my opinion that trades can be evaluated. Below is the chart and simply looking at round number theory with it the nasty reversal on 3/13 and 3/15 not only stopped at 30, but each CLOSED with a 26 handle, each finishing more than 12% off intraday highs (notice on 3/14 and 3/16 were each bearish engulfing candles and 3/20 was a bearish piercing line candle). In the month of May it has been to 20 number that provided problems for the VIX. Four sessions between 3/30-4/10 were all above 20 intraday and again the pushback was swift with each CLOSING 5% off those intraday highs. On 5/4 and 5/24 the VIX managed to finish just pennies above each time but both times the next 2 days witnessed robust pullbacks. I think this rally will remain in place as long as it can not CLOSE decisively above the 30 figure. If it does then I think the right side of the cup base below happens fast and a quick move toward 30 is possible.

International Relief?
- Is it possible that money may begin to rotate back into US equities? Last week could be the start of that happening as some softness came from Europe while the US firmed somewhat. Notice the WEEKLY chart of the DAX below could be running into a triple top. Of course, it could be a long cup base that started in late 2021 but the pattern is a little bit deep dipping just below the very round 12000 number to start Q4 last year. PRICE has memory and looking to the left one can see this level was the area of a bearish gravestone and engulfing candle. If one peeked at its daily chart they would see a bearish island reversal with a gap above 16000 on 5/18 and then a gap down on 5/24. The CAC undercut its 50-day SMA on 5/24. The IEV which is a nice collection of European large gaps from many sectors fell more than 2% as the S&P 500 rose .3% and recorded a bullish hammer candle (bears will call it a hanging man so paint your bias). With the way technology is behaving expect more good things to come from the Nasdaq, perhaps at the expense of a strong European region.

Domestic Dominance:
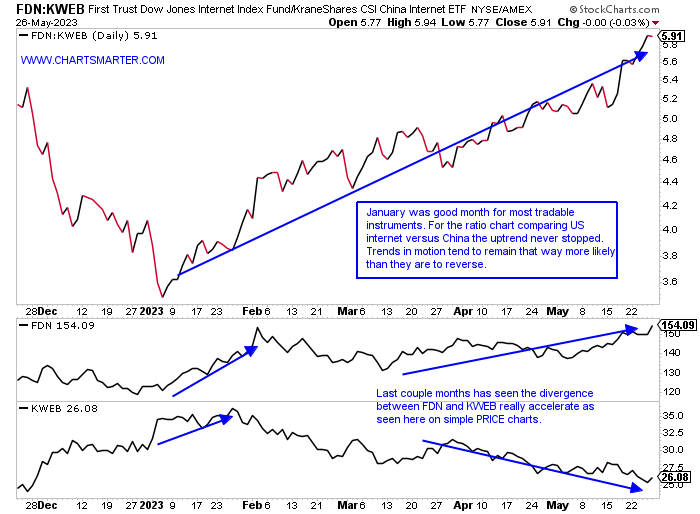
- We are well aware of the inferiority of US stocks versus international which may be changing course, but when looking at internet stocks the comparison was never in question. The ratio chart comparing the FDN to the KWEB below shows the relationship clearly. I am not sure one could have constructed a portfolio of holdings better for the current environment with the largest components in the FDN in AMZN META GOOGL and CRM. As extended as these are AMZN and GOOGL are still near proper buy points. When one takes a look at the KWEB holdings, BABA is now 36% off its peak this January and tenuously holding on to the round 80 number which is also a bearish descending triangle pivot. JD is 52% off its 52-week highs and last week fell almost 6% and undercut its last October low, a level most US internet players are miles above. Will there be some mean reversion? Of course, at some point but for the time being stick with what is working. PDD may shake things up for the KWEB as it broke ABOVE a bear flag trigger at the 60 number Friday jumping 19% and catching many for sure on the wrong side after an earnings reaction. Speaking of tech mega caps lets look below at two in AAPL and NVDA.
Apple:
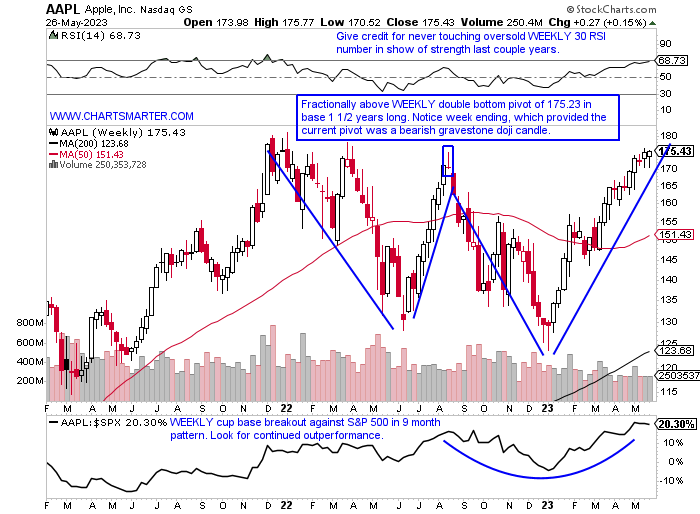
- "Old tech" giant up 35% YTD and 22% over last one year period. Dividend yield of .55%.
- Name 1% off most recent all-time highs and has not declined on a consecutive WEEKLY basis since the last week of 2022 and the first week of 2023 (both of which were bullish WEEKLY hammer candles).
- FOUR straight positive earnings reactions up 4.7, 2.4, 7.6, and 3.3% on 5/5, 2/3, 10/28, and 7/29/22.
- Enter after a WEEKLY double-bottom breakout.
- Entry AAPL here. Stop 165.
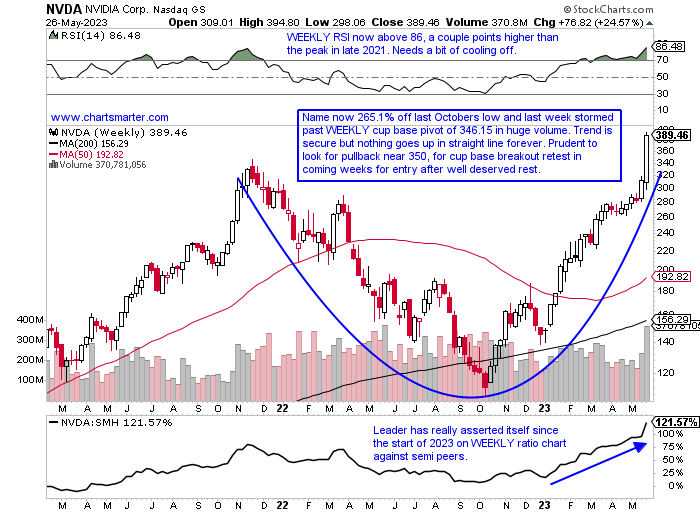
Nvidia:
- Semi leader up 166% YTD and 118% over last one year period. Dividend yield of .04%
- Name 1% off most recent all-time highs and has fallen on a WEEKLY basis just 4 times in 2023. Solid accumulation with big volume accompanying weeks ending 1/27, 3/17, and 5/26 which rose by 14.2, 12, and 24.6% respectively.
- Earnings reactions mostly higher up 24.4, 14, and 4% on 5/25, 2/23, and 8/25/22, and fell 1.5% on 11/17/22.
- Enter on pullback into WEEKLY cup base breakout.
- Entry NVDA 352. Stop 325.
Good luck.
This article requires a Chartsmarter membership. Please click here to join.
"Do not confuse brains with a bull market."
Good Habits:
- We know it is a bit premature with 2 sessions, as the debt ceiling debate comes to a conclusion, left in May but below we take a look at the MONTHLY chart of the Nasdaq and if it CLOSES in this 13000 area, it will make it 4 of the last 5 months CLOSING at highs for the MONTHLY range. Good habits are hard to break and perhaps this will be a good sign as we head into the solid seasonality period, and remember we spoke a few weeks back about how April having the tightest MONTHLY range in the last 4 years was a very bullish development. If it can climb above the 13000 number which was a speed bump last May and August that would in my opinion really put some FOMO into this rally. Over the last month's period, the semiconductors rose more than 26%, not a typo, and software is also higher by more than double digits. MRVL during that period has jumped 72% and peer PLAB has added more than 50% falling just 5 sessions during the time frame. In software AI and PLTR have advanced 86 and 76% respectively. And plenty still do not believe in this potent, overall move.

Bonds Bottoming?
- Market participants often like to gauge risk appetite by comparing the TLT to the SPY. That can be seen at the bottom of the PRICE chart below which does show the TLT in a steep downtrend since mid-March. Bears may interpret this as the major averages in need of at least a rest and maybe more. As a fan of round number theory notice how the TLT recorded a bullish engulfing candle Friday precisely at par. Since the TLT registered a bullish WEEKLY piercing line candle the week ending 10/28/22 up 4% it has defended the 100 figure well. To me, this is a trading vehicle and a bounce most likely a dead cat in nature looks plausible here. That should give equities a chance for a well-deserved breather. The SPY is watching this, and rates themselves rose meaningfully last week with the 10-year yield up more than 3% last week after the prior week rose almost 7%. Bonds may be ready for some time in the sun.

Gauging Sentiment:
- I know many frown upon the idea of doing technical analysis on the VIX, but anything in my opinion that trades can be evaluated. Below is the chart and simply looking at round number theory with it the nasty reversal on 3/13 and 3/15 not only stopped at 30, but each CLOSED with a 26 handle, each finishing more than 12% off intraday highs (notice on 3/14 and 3/16 were each bearish engulfing candles and 3/20 was a bearish piercing line candle). In the month of May it has been to 20 number that provided problems for the VIX. Four sessions between 3/30-4/10 were all above 20 intraday and again the pushback was swift with each CLOSING 5% off those intraday highs. On 5/4 and 5/24 the VIX managed to finish just pennies above each time but both times the next 2 days witnessed robust pullbacks. I think this rally will remain in place as long as it can not CLOSE decisively above the 30 figure. If it does then I think the right side of the cup base below happens fast and a quick move toward 30 is possible.

International Relief?
- Is it possible that money may begin to rotate back into US equities? Last week could be the start of that happening as some softness came from Europe while the US firmed somewhat. Notice the WEEKLY chart of the DAX below could be running into a triple top. Of course, it could be a long cup base that started in late 2021 but the pattern is a little bit deep dipping just below the very round 12000 number to start Q4 last year. PRICE has memory and looking to the left one can see this level was the area of a bearish gravestone and engulfing candle. If one peeked at its daily chart they would see a bearish island reversal with a gap above 16000 on 5/18 and then a gap down on 5/24. The CAC undercut its 50-day SMA on 5/24. The IEV which is a nice collection of European large gaps from many sectors fell more than 2% as the S&P 500 rose .3% and recorded a bullish hammer candle (bears will call it a hanging man so paint your bias). With the way technology is behaving expect more good things to come from the Nasdaq, perhaps at the expense of a strong European region.

Domestic Dominance:
- We are well aware of the inferiority of US stocks versus international which may be changing course, but when looking at internet stocks the comparison was never in question. The ratio chart comparing the FDN to the KWEB below shows the relationship clearly. I am not sure one could have constructed a portfolio of holdings better for the current environment with the largest components in the FDN in AMZN META GOOGL and CRM. As extended as these are AMZN and GOOGL are still near proper buy points. When one takes a look at the KWEB holdings, BABA is now 36% off its peak this January and tenuously holding on to the round 80 number which is also a bearish descending triangle pivot. JD is 52% off its 52-week highs and last week fell almost 6% and undercut its last October low, a level most US internet players are miles above. Will there be some mean reversion? Of course, at some point but for the time being stick with what is working. PDD may shake things up for the KWEB as it broke ABOVE a bear flag trigger at the 60 number Friday jumping 19% and catching many for sure on the wrong side after an earnings reaction. Speaking of tech mega caps lets look below at two in AAPL and NVDA.

Apple:
- "Old tech" giant up 35% YTD and 22% over last one year period. Dividend yield of .55%.
- Name 1% off most recent all-time highs and has not declined on a consecutive WEEKLY basis since the last week of 2022 and the first week of 2023 (both of which were bullish WEEKLY hammer candles).
- FOUR straight positive earnings reactions up 4.7, 2.4, 7.6, and 3.3% on 5/5, 2/3, 10/28, and 7/29/22.
- Enter after a WEEKLY double-bottom breakout.
- Entry AAPL here. Stop 165.

Nvidia:
- Semi leader up 166% YTD and 118% over last one year period. Dividend yield of .04%
- Name 1% off most recent all-time highs and has fallen on a WEEKLY basis just 4 times in 2023. Solid accumulation with big volume accompanying weeks ending 1/27, 3/17, and 5/26 which rose by 14.2, 12, and 24.6% respectively.
- Earnings reactions mostly higher up 24.4, 14, and 4% on 5/25, 2/23, and 8/25/22, and fell 1.5% on 11/17/22.
- Enter on pullback into WEEKLY cup base breakout.
- Entry NVDA 352. Stop 325.

Good luck.