Was Druck Right?
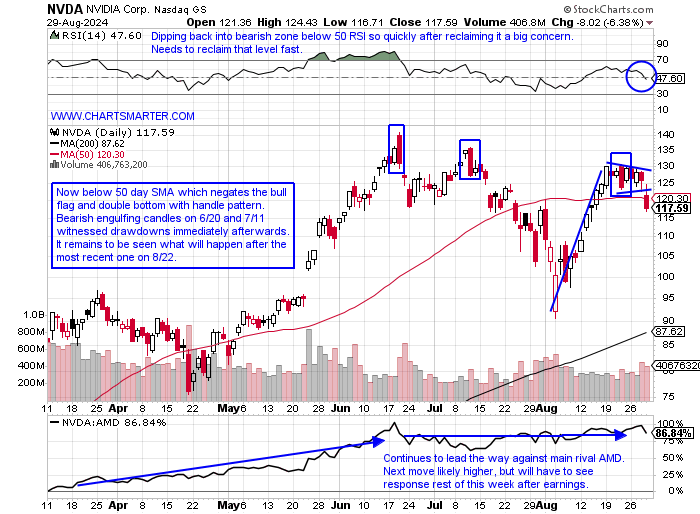
- In the latest round of 13F filings a couple of weeks back Stanley Druckenmiller had sold out of his NVDA. To be frank we do not know when he did as 13F information is backward-looking and stale. But he is looking smart as usual today with the 6% plus haircut in the stock following the earnings announcement last night. Notice on the daily chart the bearish engulfing candles on 6/20 and 7/11 were both near-term tops. The latter one's drawdown recorded a move lower of 33.4% from the top to the bottom of the range. The jury is still out over last Thursday's bearish engulfing candle, but today's move will likely have the stock needing time to repair the technical damage. We know from FALSE moves (break BELOW bull flag) come fast ones in the opposite direction. Will the market be able to navigate higher with NVDA, which makes up more than 6% of the S&P 500, floundering? With today's move, it went from the second most valuable company on the planet to third, and is no longer a member of the $3T trifecta market cap club with AAPL and MSFT.
"Paying" Its Dues:
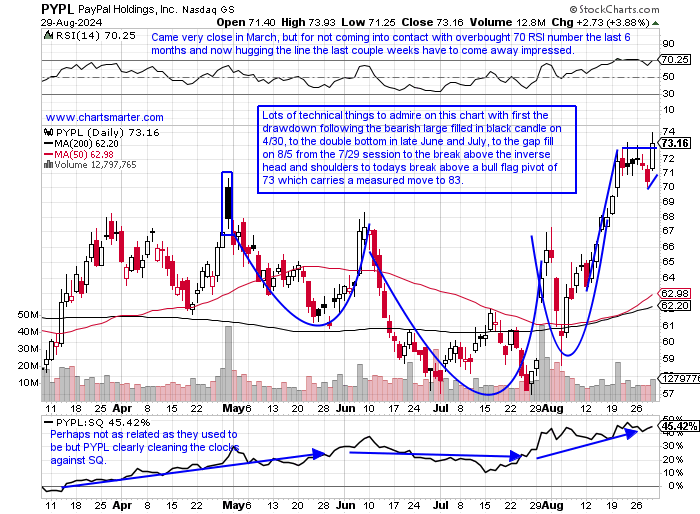
- Many names registered big moves off the overall 8/5 market lows, but not all have kept the vast majority of the gains. The chart below of former laggard PYPL has certainly went from a negative to a positive in the last 3 weeks. Since filling in a gap on 8/5 it is now looking for a fifth straight WEEKLY gain (up 2% heading into Friday), something it has not done in more than 2 years dating back to July-August 2022. The last 4 weeks have all recorded nice gains in the 4-6% neighborhood and on the WEEKLY chart it is distancing itself from the influential round 70 number, which has been both support and resistance dating back to the summer of 2022. Its MONTHLY chart has been carving out a bottom that last 24 months in a gradual fashion which is just what you want to see if bullish and is a long way off the very round 300 number where it peaked in February 2021 recording a bearish shooting star and CLOSING 50 handles off that intramonth high.
Recent Examples:
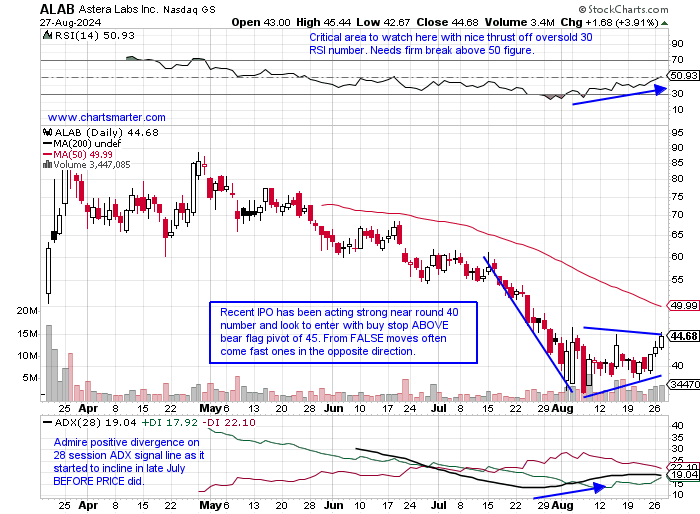
- The semiconductors were in focus Thursday with the NVDA earnings reaction front and center. But some others were garnering attention on their merit and the daily chart of ALAB and how it appeared in our 8/28 Technology Note may be a good example. This for sure has been an absolute laggard among an overall strong semiconductor space in 2024 but technical analysis gives us a chance to identify when weak actors may be ready to shed their former negative selves. We did admire its strong relative strength versus its peers up better than 2% last week more than doubling the advance of the SMH, and this week headed into Friday is really starting to shine up 15% as the SMH has declined more than 4%. Thursday was rejected at the very round 50 number and the 50-day SMA intraday so it will be imperative for it to stay in the vicinity of this area and not lose altitude. A break above 50 could be very powerful into year-end. Notice too 50 was exactly where the stock started trading back on 3/20, the first day it started trading publicly.
Special Situations:
Shift4 Payments:
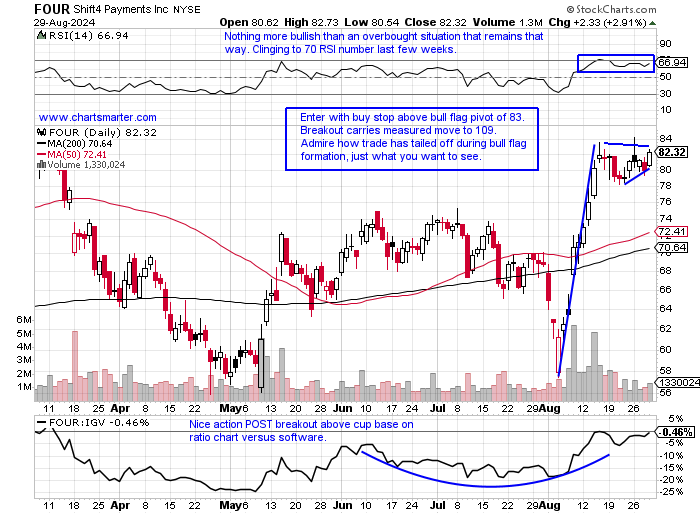
- Software play up 11% YTD and 43% over last one year period.
- Name 11% off most recent 52-week highs and MONTHLY chart shows moving toward cup with handle pattern pivot of 92.40, and August with one session left still shows best MONTHLY volume ever. Notice how very round par number pushed name back between March-July 2021 (doji candle in June).
- FOUR straight positive earnings reactions up 11.3, 3.9, 5.5, and 13.9% on 8/8, 5/9, 2/27 and 11/8/23.
- Enter with buy stop above bull flag.
- Entry FOUR 83. Stop 79.
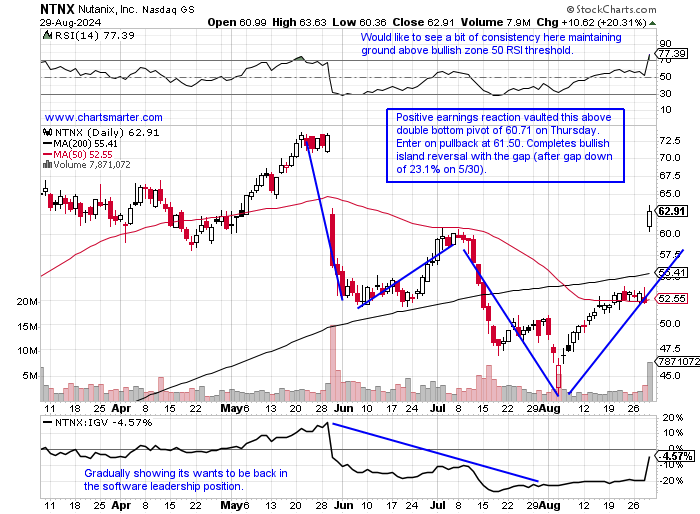
Nutanix:
- Software play up 32% YTD and 104% over last one year period.
- Name 15% off most recent 52-week highs and MONTHLY chart shows big range in August with one session left Friday. Potential for break above 64.97 cup base pivot in pattern that began in June 2018. Was above trigger intramonth during March-May but none were able to CLOSE above it.
- Earnings reactions mostly higher up 20.3, 7, and 3.7% on 8/29, 2/29, and 11/30/23, and fell 23.1% on 5/30.
- Enter after bullish island reversal/breakout above double bottom base.
- Entry NTNX 61.50. Stop 58.
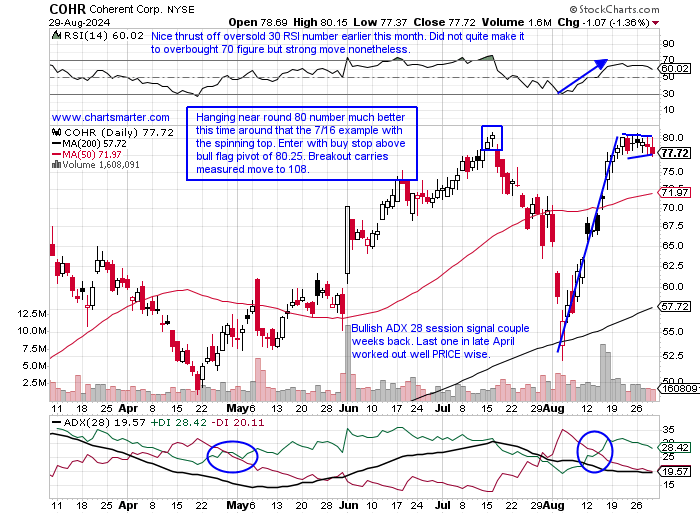
Coherent:
- Electronic components play up 82% YTD and 114% over last one year period.
- Name 4% off most recent 52-week highs and MONTHLY chart shows this potentially approaching very round par number that would be a pivot in a cup base that began in February 2021. That month recorded a bearish shooting star CLOSING 16% off intramonth highs.
- Earnings reactions mostly higher up 7.5 and 17.4% on 8/16, 2/6, UNCH on 11/7/23, and fell 4.5% on 5/7.
- Enter with buy stop above bull flag.
- Entry COHR 80.25. Stop 77.
Good luck.
Entry summaries:
Buy stop above bull flag FOUR 83. Stop 79.
Buy after bullish island reversal/breakout above double bottom base NTNX 61.50. Stop 58.
Buy stop above bull flag COHR 80.25. Stop 77.
This article requires a Chartsmarter membership. Please click here to join.
Was Druck Right?
- In the latest round of 13F filings a couple of weeks back Stanley Druckenmiller had sold out of his NVDA. To be frank we do not know when he did as 13F information is backward-looking and stale. But he is looking smart as usual today with the 6% plus haircut in the stock following the earnings announcement last night. Notice on the daily chart the bearish engulfing candles on 6/20 and 7/11 were both near-term tops. The latter one's drawdown recorded a move lower of 33.4% from the top to the bottom of the range. The jury is still out over last Thursday's bearish engulfing candle, but today's move will likely have the stock needing time to repair the technical damage. We know from FALSE moves (break BELOW bull flag) come fast ones in the opposite direction. Will the market be able to navigate higher with NVDA, which makes up more than 6% of the S&P 500, floundering? With today's move, it went from the second most valuable company on the planet to third, and is no longer a member of the $3T trifecta market cap club with AAPL and MSFT.
"Paying" Its Dues:
- Many names registered big moves off the overall 8/5 market lows, but not all have kept the vast majority of the gains. The chart below of former laggard PYPL has certainly went from a negative to a positive in the last 3 weeks. Since filling in a gap on 8/5 it is now looking for a fifth straight WEEKLY gain (up 2% heading into Friday), something it has not done in more than 2 years dating back to July-August 2022. The last 4 weeks have all recorded nice gains in the 4-6% neighborhood and on the WEEKLY chart it is distancing itself from the influential round 70 number, which has been both support and resistance dating back to the summer of 2022. Its MONTHLY chart has been carving out a bottom that last 24 months in a gradual fashion which is just what you want to see if bullish and is a long way off the very round 300 number where it peaked in February 2021 recording a bearish shooting star and CLOSING 50 handles off that intramonth high.
Recent Examples:
- The semiconductors were in focus Thursday with the NVDA earnings reaction front and center. But some others were garnering attention on their merit and the daily chart of ALAB and how it appeared in our 8/28 Technology Note may be a good example. This for sure has been an absolute laggard among an overall strong semiconductor space in 2024 but technical analysis gives us a chance to identify when weak actors may be ready to shed their former negative selves. We did admire its strong relative strength versus its peers up better than 2% last week more than doubling the advance of the SMH, and this week headed into Friday is really starting to shine up 15% as the SMH has declined more than 4%. Thursday was rejected at the very round 50 number and the 50-day SMA intraday so it will be imperative for it to stay in the vicinity of this area and not lose altitude. A break above 50 could be very powerful into year-end. Notice too 50 was exactly where the stock started trading back on 3/20, the first day it started trading publicly.
Special Situations:
Shift4 Payments:
- Software play up 11% YTD and 43% over last one year period.
- Name 11% off most recent 52-week highs and MONTHLY chart shows moving toward cup with handle pattern pivot of 92.40, and August with one session left still shows best MONTHLY volume ever. Notice how very round par number pushed name back between March-July 2021 (doji candle in June).
- FOUR straight positive earnings reactions up 11.3, 3.9, 5.5, and 13.9% on 8/8, 5/9, 2/27 and 11/8/23.
- Enter with buy stop above bull flag.
- Entry FOUR 83. Stop 79.
Nutanix:
- Software play up 32% YTD and 104% over last one year period.
- Name 15% off most recent 52-week highs and MONTHLY chart shows big range in August with one session left Friday. Potential for break above 64.97 cup base pivot in pattern that began in June 2018. Was above trigger intramonth during March-May but none were able to CLOSE above it.
- Earnings reactions mostly higher up 20.3, 7, and 3.7% on 8/29, 2/29, and 11/30/23, and fell 23.1% on 5/30.
- Enter after bullish island reversal/breakout above double bottom base.
- Entry NTNX 61.50. Stop 58.
Coherent:
- Electronic components play up 82% YTD and 114% over last one year period.
- Name 4% off most recent 52-week highs and MONTHLY chart shows this potentially approaching very round par number that would be a pivot in a cup base that began in February 2021. That month recorded a bearish shooting star CLOSING 16% off intramonth highs.
- Earnings reactions mostly higher up 7.5 and 17.4% on 8/16, 2/6, UNCH on 11/7/23, and fell 4.5% on 5/7.
- Enter with buy stop above bull flag.
- Entry COHR 80.25. Stop 77.
Good luck.
Entry summaries:
Buy stop above bull flag FOUR 83. Stop 79.
Buy after bullish island reversal/breakout above double bottom base NTNX 61.50. Stop 58.
Buy stop above bull flag COHR 80.25. Stop 77.