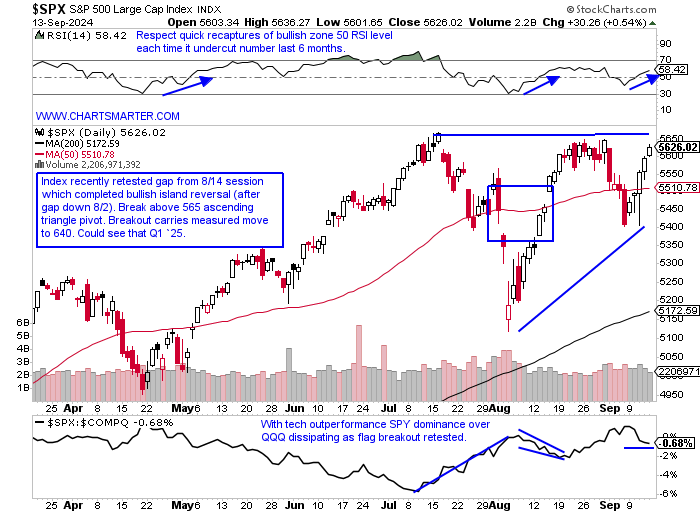
Resilience:
- With everything going on at the moment let us give credit to the S&P 500 for climbing back toward all-time highs for a third time in the space of just 2 months. Will the third time be the charm for breaking above the pesky 565 area? Sagging oil PRICES, war, the upcoming election, etc, and the widely watched benchmark is beating to it's own drum. A failed double-bottom breakout above a 5566 pivot so quickly afterward, is always seen as a red flag, but again PRICE is omnipotent and is stating higher ones like ahead. The MONTHLY chart is on a 4-month win streak and since the COVID lows that has occurred four times and each time went on to gain at least one more month. The S&P 500 has gained 9 of the last 10 months and in my opinion its trajectory will take a similar path to the one which advanced 14 of 17 months from April 2020 to August 2021. It feels like many were positioned for seasonality weakness and that has to be unwound just before the start of a historically strong Q4. And the WEEKLY chart now challenging the week ending 9/6's completion of a dubious evening star (doji candle week ending 8/30 as well) and the bearish engulfing candle from 7/19 is speaking volumes about its tenacity.
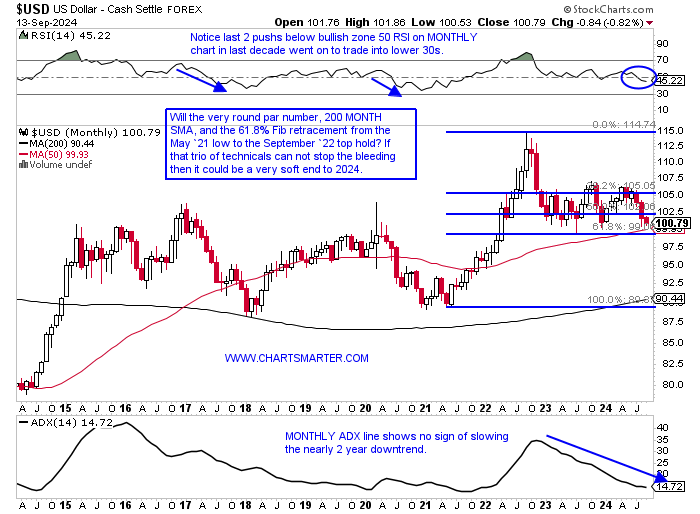
Dollar Difficulty:
- The greenbacks angst has been a tailwind for commodities as of late. The MONTHLY chart below shows the precipitous drop from 115 in late 2022 to par here and will the trio of technical signs here put an end to the selling? The WEEKLY chart here shows RSI sitting at the oversold 30 number, and bears are salivating as they know there is nothing more bearish than an oversold situation that remains that way. Anothers feather in the cap for the naysayers is that the 200 WEEK SMA, which is supposed to act like a springboard for PRICE, currently looks like a rest stop. This needs to distance itself quickly or an undercut of the secular line is a real possibility. On the DAILY chart the Bollinger Bands are beginning to constrict and the last 2 times they tightened in July and August the downtrend resumed. Notice last Tuesday-Thursday for the first time in 2 months the dollar climbed above the middle line (moving average) of the Bollinger Bands only to gap back below Friday. My opinion is that the 50 MONTH SMA will be undercut (like it did in 2018 and 2020) with plenty of stops just underneath par toward 96-97 then a possible bounce back. The key for a positive turnaround will be the bullish MONTHLY MACD crossover, which has not occurred since the summer of 202. It was rejected attempting to do so late last year and mid 2024 but ultimately proved unsuccessful.
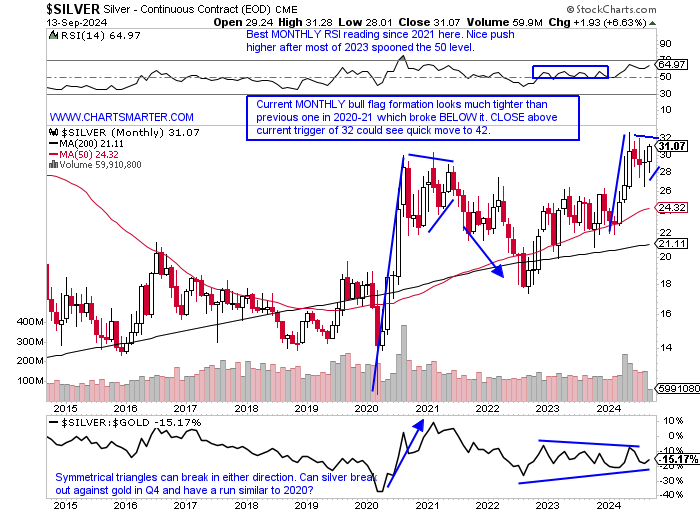
Silver Lining:
- Silver recorded a powerful run last week of 10% and it can now focus on a double bottom pivot of 32.12. Looking at the last 2 robust WEEKLY gains in the precious metal has weak follow through. Notice here the week ending 5/17 screamed higher by almost 12%, and the very next week fell 4% registering a bearish dark cloud cover candle, and then the week ending 7/5 added 7.2% only to lose ground the next 3 weeks falling by a combined 10%. So bulls want to see the current PRICE action act a bit more sanguine. The MONTHLY chart below shows a bull flag forming and a push in the next couple weeks to end September above 32 could go a long way. Both July and August finished with a spinning top and a doji candle, but if they can be negated that would be a huge positive. Sentiment does seem a bit bulled up but PRICE can not be ignored. For the round number believers the 30 figure on the MONTHLY chart remains elusive. In August 2021 it traded as high as 29.91 before backing off and the very next month was a bearish engulfing candle plunging 17%. February 2021 traded slightly above it to a high of 30.35 only to CLOSE with a 26 handle. Fast forward to today and May CLOSED at 30.44, but the next 3 months were all above 30 but could not finish above. Was do the last 11 sessions of September have in store? Is a decisive break above a 4 year cup base on tap? Buckle your seat belts.
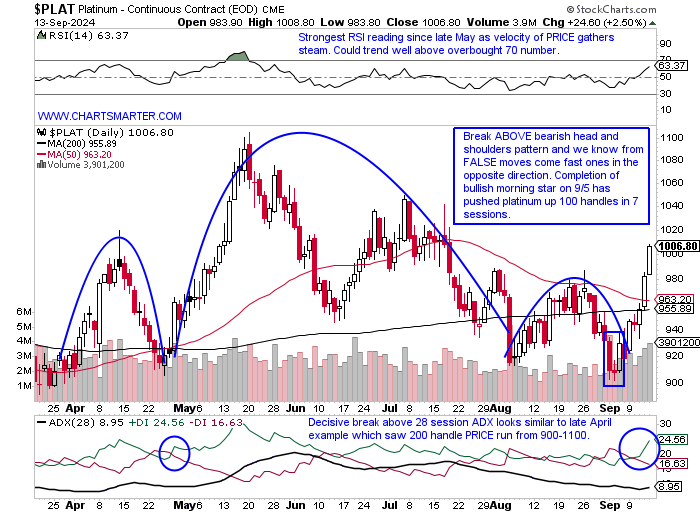
Platinum Pushing:
- Platinum is on the ascent. The daily chart below shows the break above the bearish head and shoulders pattern, but this could be looked at in another way with Friday recording a break above a double bottom pivot of 988. Round number theory is coming into play here and it has not yet paused at the very round 1000 figure. The metal was sheepish around this level in late July and August (notice too the bearish engulfing candle on 5/20 at 1100) with a bearish engulfing candle on 8/1. The WEEKLY chart shows a double bottom pivot of 1050 setting up after last week stormed above its 200 WEEK SMA jumping almost 10% in the best WEEKLY volume since late May. We are only half way through September but so far on the MONTHLY chart a bullish engulfing candle is being recorded and the last time that occurred was at during November 2020, which kicked off a 6 month win streak that rose by a combined 61% top to bottom of the range. A MONTHLY symmetrical triangle has now taken shape and watch for a potential move above an 1100 trigger into year end which a breakout would carry a measured move to 1650. Seasonality is strong in September compared to most metals with a nearly UNCH reading, and then look at the last 3 months of the year and how powerful the gains have been culminating in Decembers average rise over the last 4 years at 7% CLOSING the month higher from where it started every time.
Regional Consumer Differences:
- One can explore the health of consumers in China and domestically by the PRICE action in the major internet players of both countries. Below is the ratio chart comparing KWEB to the FDN. One can see the bullish action in the latter. The FDN trades just 4% off its most recent 52 week highs, while KWEB is 22% off its annual peak made in May. It may be an unfair comparison as the FDN has technology names within but AMZN makes up 10% of the fund, as well as NFLX (at 7%). Inside KWEB there have been some real laggards especially in former leader PDD which plunged 31% the week ending 8/30 in the largest WEEKLY volume in at least 5 years on an ill received earnings reaction and has now CLOSED 3 straight weeks below the 200 WEEK SMA. But BABA is assuming leadership as it trades near a cup with handle pivot of 85.89. Below we take a look at a couple of names in the Asian area in TM and ATAT. The former leader in Toyota may be looking at a technical turnaround and offers good risk/reward here.
Toyota:
- Japanese auto play down 5% YTD and 7% over last one year period. Dividend yield of 2.7%.
- Name 31% off most recent 52-week highs (HMC "just" 17% off its annual peak) and since its peak week ending 3/29 has declined 15 of 25 weeks. Now touching 50 MONTH SMA for initial time following break above cup base pivot of 213.84 in March, often an ideal entry point. Bullish hammer candle in August.
- FOUR straight positive earnings reactions up .2, 7.8, 6, and 2.1% on 5/8, 2/6, 11/1, and 8/1/23.
- Enter after WEEKLY doji candle at 200 WEEK SMA support.
- Entry TM here. Stop 169.
Atour Lifestyle Holdings:
- Chinese hotel play up 13% YTD and 1% over last one year period. Dividend yield of 2.3%.
- Name 3% off most recent 52-week highs and DAILY chart shows reluctance at very round 20 number with bearish engulfing candle Friday down 3.1%. Pulling back into break above double bottom pivot of 19.31 from 9/5. Has not declined in consecutive sessions since end of July.
- Earnings reactions mostly lower off .3, 5.6, and 2.5% on 5/23, 3/28, and 11/16/23 before recent gain of 13.3% on 8/29.
- Enter on pullback into break ABOVE bearish WEEKLY descending triangle.
- Entry ATAT 19.25. Stop 18.25.
This article requires a Chartsmarter membership. Please click here to join.
Resilience:
- With everything going on at the moment let us give credit to the S&P 500 for climbing back toward all-time highs for a third time in the space of just 2 months. Will the third time be the charm for breaking above the pesky 565 area? Sagging oil PRICES, war, the upcoming election, etc, and the widely watched benchmark is beating to it's own drum. A failed double-bottom breakout above a 5566 pivot so quickly afterward, is always seen as a red flag, but again PRICE is omnipotent and is stating higher ones like ahead. The MONTHLY chart is on a 4-month win streak and since the COVID lows that has occurred four times and each time went on to gain at least one more month. The S&P 500 has gained 9 of the last 10 months and in my opinion its trajectory will take a similar path to the one which advanced 14 of 17 months from April 2020 to August 2021. It feels like many were positioned for seasonality weakness and that has to be unwound just before the start of a historically strong Q4. And the WEEKLY chart now challenging the week ending 9/6's completion of a dubious evening star (doji candle week ending 8/30 as well) and the bearish engulfing candle from 7/19 is speaking volumes about its tenacity.
Dollar Difficulty:
- The greenbacks angst has been a tailwind for commodities as of late. The MONTHLY chart below shows the precipitous drop from 115 in late 2022 to par here and will the trio of technical signs here put an end to the selling? The WEEKLY chart here shows RSI sitting at the oversold 30 number, and bears are salivating as they know there is nothing more bearish than an oversold situation that remains that way. Anothers feather in the cap for the naysayers is that the 200 WEEK SMA, which is supposed to act like a springboard for PRICE, currently looks like a rest stop. This needs to distance itself quickly or an undercut of the secular line is a real possibility. On the DAILY chart the Bollinger Bands are beginning to constrict and the last 2 times they tightened in July and August the downtrend resumed. Notice last Tuesday-Thursday for the first time in 2 months the dollar climbed above the middle line (moving average) of the Bollinger Bands only to gap back below Friday. My opinion is that the 50 MONTH SMA will be undercut (like it did in 2018 and 2020) with plenty of stops just underneath par toward 96-97 then a possible bounce back. The key for a positive turnaround will be the bullish MONTHLY MACD crossover, which has not occurred since the summer of 202. It was rejected attempting to do so late last year and mid 2024 but ultimately proved unsuccessful.
Silver Lining:
- Silver recorded a powerful run last week of 10% and it can now focus on a double bottom pivot of 32.12. Looking at the last 2 robust WEEKLY gains in the precious metal has weak follow through. Notice here the week ending 5/17 screamed higher by almost 12%, and the very next week fell 4% registering a bearish dark cloud cover candle, and then the week ending 7/5 added 7.2% only to lose ground the next 3 weeks falling by a combined 10%. So bulls want to see the current PRICE action act a bit more sanguine. The MONTHLY chart below shows a bull flag forming and a push in the next couple weeks to end September above 32 could go a long way. Both July and August finished with a spinning top and a doji candle, but if they can be negated that would be a huge positive. Sentiment does seem a bit bulled up but PRICE can not be ignored. For the round number believers the 30 figure on the MONTHLY chart remains elusive. In August 2021 it traded as high as 29.91 before backing off and the very next month was a bearish engulfing candle plunging 17%. February 2021 traded slightly above it to a high of 30.35 only to CLOSE with a 26 handle. Fast forward to today and May CLOSED at 30.44, but the next 3 months were all above 30 but could not finish above. Was do the last 11 sessions of September have in store? Is a decisive break above a 4 year cup base on tap? Buckle your seat belts.
Platinum Pushing:
- Platinum is on the ascent. The daily chart below shows the break above the bearish head and shoulders pattern, but this could be looked at in another way with Friday recording a break above a double bottom pivot of 988. Round number theory is coming into play here and it has not yet paused at the very round 1000 figure. The metal was sheepish around this level in late July and August (notice too the bearish engulfing candle on 5/20 at 1100) with a bearish engulfing candle on 8/1. The WEEKLY chart shows a double bottom pivot of 1050 setting up after last week stormed above its 200 WEEK SMA jumping almost 10% in the best WEEKLY volume since late May. We are only half way through September but so far on the MONTHLY chart a bullish engulfing candle is being recorded and the last time that occurred was at during November 2020, which kicked off a 6 month win streak that rose by a combined 61% top to bottom of the range. A MONTHLY symmetrical triangle has now taken shape and watch for a potential move above an 1100 trigger into year end which a breakout would carry a measured move to 1650. Seasonality is strong in September compared to most metals with a nearly UNCH reading, and then look at the last 3 months of the year and how powerful the gains have been culminating in Decembers average rise over the last 4 years at 7% CLOSING the month higher from where it started every time.
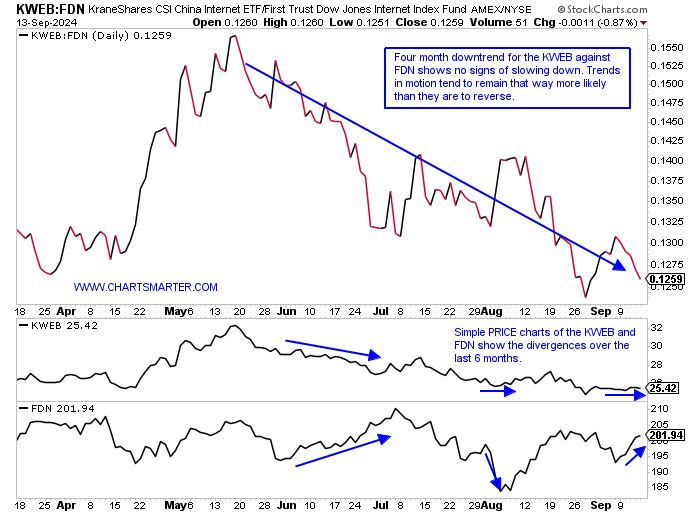
Regional Consumer Differences:
- One can explore the health of consumers in China and domestically by the PRICE action in the major internet players of both countries. Below is the ratio chart comparing KWEB to the FDN. One can see the bullish action in the latter. The FDN trades just 4% off its most recent 52 week highs, while KWEB is 22% off its annual peak made in May. It may be an unfair comparison as the FDN has technology names within but AMZN makes up 10% of the fund, as well as NFLX (at 7%). Inside KWEB there have been some real laggards especially in former leader PDD which plunged 31% the week ending 8/30 in the largest WEEKLY volume in at least 5 years on an ill received earnings reaction and has now CLOSED 3 straight weeks below the 200 WEEK SMA. But BABA is assuming leadership as it trades near a cup with handle pivot of 85.89. Below we take a look at a couple of names in the Asian area in TM and ATAT. The former leader in Toyota may be looking at a technical turnaround and offers good risk/reward here.
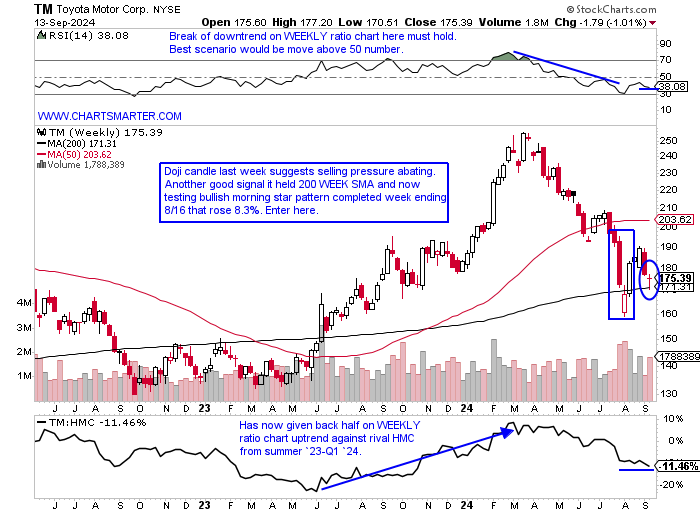
Toyota:
- Japanese auto play down 5% YTD and 7% over last one year period. Dividend yield of 2.7%.
- Name 31% off most recent 52-week highs (HMC "just" 17% off its annual peak) and since its peak week ending 3/29 has declined 15 of 25 weeks. Now touching 50 MONTH SMA for initial time following break above cup base pivot of 213.84 in March, often an ideal entry point. Bullish hammer candle in August.
- FOUR straight positive earnings reactions up .2, 7.8, 6, and 2.1% on 5/8, 2/6, 11/1, and 8/1/23.
- Enter after WEEKLY doji candle at 200 WEEK SMA support.
- Entry TM here. Stop 169.
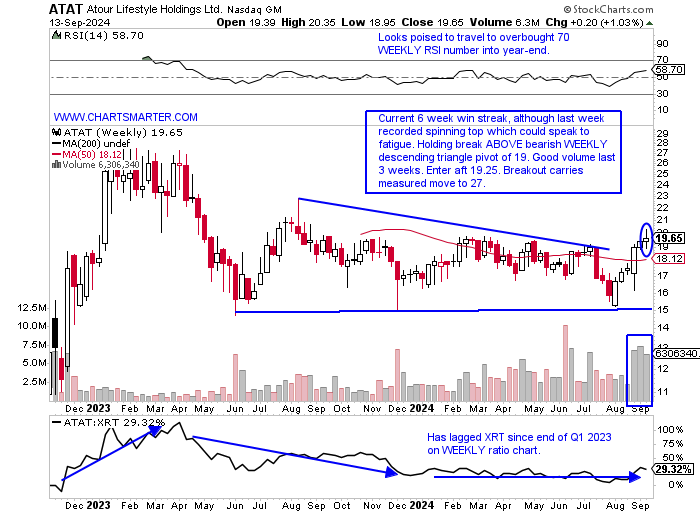
Atour Lifestyle Holdings:
- Chinese hotel play up 13% YTD and 1% over last one year period. Dividend yield of 2.3%.
- Name 3% off most recent 52-week highs and DAILY chart shows reluctance at very round 20 number with bearish engulfing candle Friday down 3.1%. Pulling back into break above double bottom pivot of 19.31 from 9/5. Has not declined in consecutive sessions since end of July.
- Earnings reactions mostly lower off .3, 5.6, and 2.5% on 5/23, 3/28, and 11/16/23 before recent gain of 13.3% on 8/29.
- Enter on pullback into break ABOVE bearish WEEKLY descending triangle.
- Entry ATAT 19.25. Stop 18.25.