Stay Openminded:
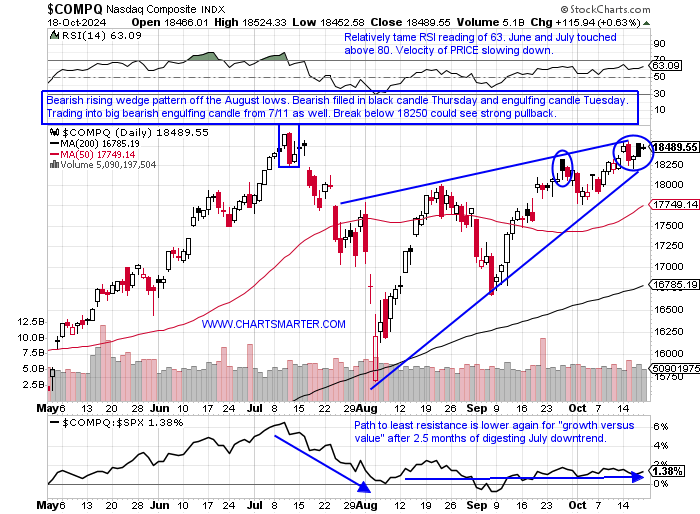
- Looking at the WEEKLY returns last week the two best performers were from defensive groups, in the utilities and real estate, which each screamed higher by more than 3%. Of course, that is a small sample size but after the move that technology has seen from the early August lows is there a pullback in store? PRICE action could be potentially hitting a double top with the early July time-period and some dubious candles were recorded last week. Thursday was more suspicious with the bearish filled-in black candle, and the prior example 9/26 witnessed a quick 600 handle drop before the uptrend resumed. We are also trading into the bearish engulfing candle from 7/11 which started a rapid 16% decline from top to the bottom of the range to the 8/5 intraday lows. A move below the 18250 bearish rising wedge pattern would carry a measured move to 16200. I remain bullish overall and I think that possibility is remote but something one must be cognizant of. Keep in mind on the Nasdaq WEEKLY chart we are trading into the bearish evening star pattern (doji candle in the middle), and on the MONTHLY chart we are so far negating the August doji candle which had a 3000 handle range, and that was after the huge move off the very round 10000 figure to start 2023.
"Zoom" In:
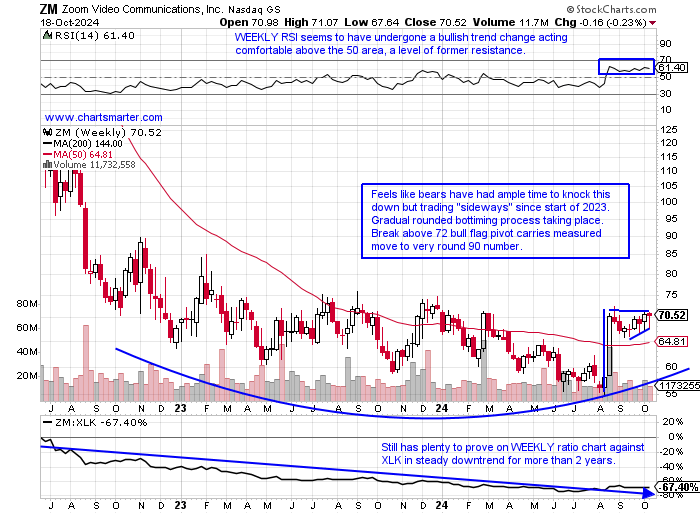
- On the WEEKLY chart that is. This is a classic COVID-era play and it suffered just like those that skyrocketed during those times. Think PTON which broke above a bull flag pivot of 5.25 last week which carries a measured move to 7.75, and that flag formed during a double bottom breakout pivot of 3.90 from 8/22. The PRICE has more than doubled over the last 2 months, not a typo, and Tuesday recorded a bearish dark cloud cover candle, but Friday negated that. TDOC sports a bullish inverse head and shoulders pattern at the very round 10 number and recently registered a bullish island reversal with the gap up on 9/17 (after the gap down on 8/1 and notice the gravestone doji candle on the middle session of a bearish evening star pattern on 7/17). Getting back to the WEEKLY chart below of ZM admire how it digests the 21% advance the week ending 8/23 very well the last 8 weeks. On the MONTHLY chart, we can see how round number theory did play a role in its precipitous original freefall with the bearish shooting star near 600 from October 202o. Respect the bullish MONTHLY RSI divergence for the last 2 years.
Recent Examples:
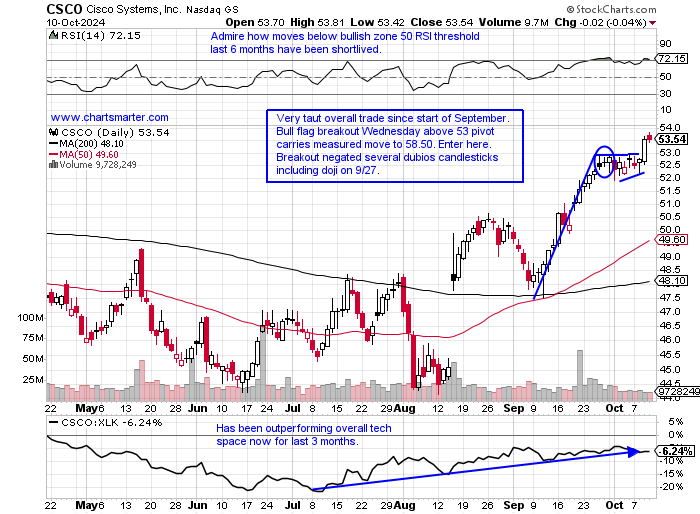
- "Old tech" names continue to make a splash. IBM is higher 19 of the last 24 weeks and is higher by 68% over the last one-year period and still sports a dividend yield close to 3%. Last week recorded a spinning top candle which could be indicating fatigue as it is well above a cup base pivot of 195.56 from mid-August (measured move to 230 from the breakout now achieved). AAPL, the largest company on the planet, is honing in on a cup base pivot of 237.06, and a move above would certainly be bullish for the overall market. Below is another one that does not get much press with the daily chart below of CSCO and how it appeared in our 10/11 Technology Note. I am old enough to remember how CSCO and JNPR were joined by the hip, and the latter was taken out by HPE in early January. Cisco is on a pedestrian run in 2024 so far up "just" 12%, and notice on its WEEKLY chart it is now at 52-week highs and acting well POST breakout above a double bottom pivot of 51.46. The right side of the base firmed up twice in the 44 area first with a bullish morning star the week ending 6/21 and then a bullish engulfing week ending 8/16.
Special Situations:
Coherent:
- Tech play up 126% YTD and 208% over last one year period.
- Name 8% off most recent 52-week highs and MONTHLY chart trying to break above very round par number in base that dates back to February 2021. Could be on verge on 7-year break above downtrend on ratio chart against overall technology.
- Earnings reactions mostly higher up 7.5 and 17.4% on 8/16, 2/6, UNCH on 11/7/23, and fell 4.5% on 5/7.
- Enter on pullback into bull flag breakout/21-day SMA.
- Entry COHR 96. Stop 93.

Rambus:
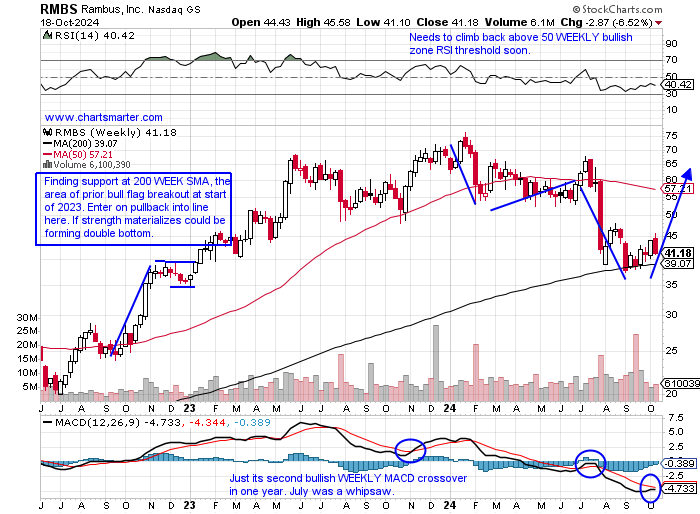
- "Old tech" semi play down40% YTD and 26% over last one year period.
- Name 46% off most recent 52-week highs and MONTHLY chart shows 3-month losing streak (just the third time since 2018) and notice September recorded bullish hammer candle off 50 MONTH SMA in largest MONTHLY volume in at least 10 years.
- Earnings reactions mostly lower off 13, 9.3, and 19.2% on 7/30, 4/30 and 2/6 and rose 9.4% on 10/31/23.
- Enter on pullback into 200 WEEK SMA.
- Entry RMBS here. Stop 38.50 (REPORTS 10/28 after close).
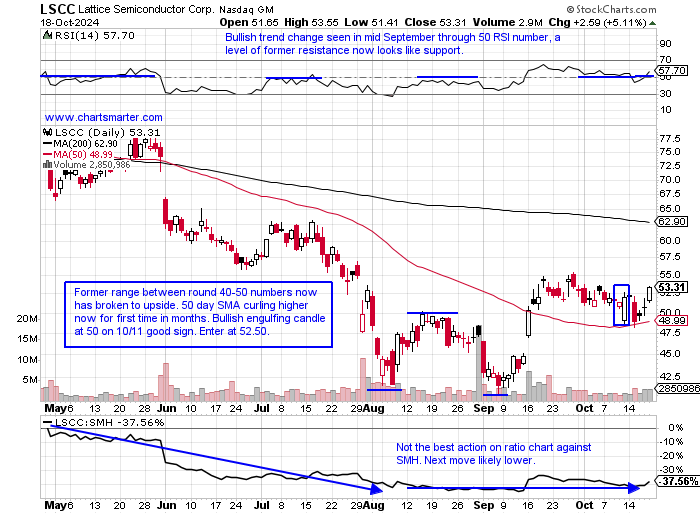
Lattice Semiconductor:
- "Old tech" semi play down 23% YTD and 28% over last one year period.
- Name 38% off most recent 52-week highs and MONTHLY chart shows huge run between 2019-21 which was stopped cold right at very round par number in summer of 2023. Last 2 months CLOSED well off lows and possible double bottom base forming.
- Earnings reactions mostly lower off 9.4, 10.7, and 17.4% on 7/30, 4/30, and 10/31/23 and rose 1.8% on 2/13.
- Enter on pullback into very round number/bullish engulfing candle.
- Entry LSCC 52.50. Stop 49.
Good luck.
Entry summaries:
Buy pullback into bull flag breakout/21-day SMA COHR 96. Stop 93.
Buy pullback into 200 WEEK SMA RMBS here. Stop 38.50.
Buy pullback into very round number/bullish engulfing candle LSCC 52.50. Stop 49.
This article requires a Chartsmarter membership. Please click here to join.
Stay Openminded:
- Looking at the WEEKLY returns last week the two best performers were from defensive groups, in the utilities and real estate, which each screamed higher by more than 3%. Of course, that is a small sample size but after the move that technology has seen from the early August lows is there a pullback in store? PRICE action could be potentially hitting a double top with the early July time-period and some dubious candles were recorded last week. Thursday was more suspicious with the bearish filled-in black candle, and the prior example 9/26 witnessed a quick 600 handle drop before the uptrend resumed. We are also trading into the bearish engulfing candle from 7/11 which started a rapid 16% decline from top to the bottom of the range to the 8/5 intraday lows. A move below the 18250 bearish rising wedge pattern would carry a measured move to 16200. I remain bullish overall and I think that possibility is remote but something one must be cognizant of. Keep in mind on the Nasdaq WEEKLY chart we are trading into the bearish evening star pattern (doji candle in the middle), and on the MONTHLY chart we are so far negating the August doji candle which had a 3000 handle range, and that was after the huge move off the very round 10000 figure to start 2023.

"Zoom" In:
- On the WEEKLY chart that is. This is a classic COVID-era play and it suffered just like those that skyrocketed during those times. Think PTON which broke above a bull flag pivot of 5.25 last week which carries a measured move to 7.75, and that flag formed during a double bottom breakout pivot of 3.90 from 8/22. The PRICE has more than doubled over the last 2 months, not a typo, and Tuesday recorded a bearish dark cloud cover candle, but Friday negated that. TDOC sports a bullish inverse head and shoulders pattern at the very round 10 number and recently registered a bullish island reversal with the gap up on 9/17 (after the gap down on 8/1 and notice the gravestone doji candle on the middle session of a bearish evening star pattern on 7/17). Getting back to the WEEKLY chart below of ZM admire how it digests the 21% advance the week ending 8/23 very well the last 8 weeks. On the MONTHLY chart, we can see how round number theory did play a role in its precipitous original freefall with the bearish shooting star near 600 from October 202o. Respect the bullish MONTHLY RSI divergence for the last 2 years.

Recent Examples:
- "Old tech" names continue to make a splash. IBM is higher 19 of the last 24 weeks and is higher by 68% over the last one-year period and still sports a dividend yield close to 3%. Last week recorded a spinning top candle which could be indicating fatigue as it is well above a cup base pivot of 195.56 from mid-August (measured move to 230 from the breakout now achieved). AAPL, the largest company on the planet, is honing in on a cup base pivot of 237.06, and a move above would certainly be bullish for the overall market. Below is another one that does not get much press with the daily chart below of CSCO and how it appeared in our 10/11 Technology Note. I am old enough to remember how CSCO and JNPR were joined by the hip, and the latter was taken out by HPE in early January. Cisco is on a pedestrian run in 2024 so far up "just" 12%, and notice on its WEEKLY chart it is now at 52-week highs and acting well POST breakout above a double bottom pivot of 51.46. The right side of the base firmed up twice in the 44 area first with a bullish morning star the week ending 6/21 and then a bullish engulfing week ending 8/16.

Special Situations:
Coherent:
- Tech play up 126% YTD and 208% over last one year period.
- Name 8% off most recent 52-week highs and MONTHLY chart trying to break above very round par number in base that dates back to February 2021. Could be on verge on 7-year break above downtrend on ratio chart against overall technology.
- Earnings reactions mostly higher up 7.5 and 17.4% on 8/16, 2/6, UNCH on 11/7/23, and fell 4.5% on 5/7.
- Enter on pullback into bull flag breakout/21-day SMA.
- Entry COHR 96. Stop 93.

Rambus:
- "Old tech" semi play down40% YTD and 26% over last one year period.
- Name 46% off most recent 52-week highs and MONTHLY chart shows 3-month losing streak (just the third time since 2018) and notice September recorded bullish hammer candle off 50 MONTH SMA in largest MONTHLY volume in at least 10 years.
- Earnings reactions mostly lower off 13, 9.3, and 19.2% on 7/30, 4/30 and 2/6 and rose 9.4% on 10/31/23.
- Enter on pullback into 200 WEEK SMA.
- Entry RMBS here. Stop 38.50 (REPORTS 10/28 after close).

Lattice Semiconductor:
- "Old tech" semi play down 23% YTD and 28% over last one year period.
- Name 38% off most recent 52-week highs and MONTHLY chart shows huge run between 2019-21 which was stopped cold right at very round par number in summer of 2023. Last 2 months CLOSED well off lows and possible double bottom base forming.
- Earnings reactions mostly lower off 9.4, 10.7, and 17.4% on 7/30, 4/30, and 10/31/23 and rose 1.8% on 2/13.
- Enter on pullback into very round number/bullish engulfing candle.
- Entry LSCC 52.50. Stop 49.

Good luck.
Entry summaries:
Buy pullback into bull flag breakout/21-day SMA COHR 96. Stop 93.
Buy pullback into 200 WEEK SMA RMBS here. Stop 38.50.
Buy pullback into very round number/bullish engulfing candle LSCC 52.50. Stop 49.