- For long-term investors, the old adage "buy low and sell high" does not always apply. Often they will buy high and sell higher. What this means is that the best stocks often offer add-on buy points on the way UP. As we await the earnings from TSLA after the CLOSE Wednesday afternoon GM already did so and it was impressive. Below is how we looked at the name in our 8/19 Consumer Note.
General Motors:
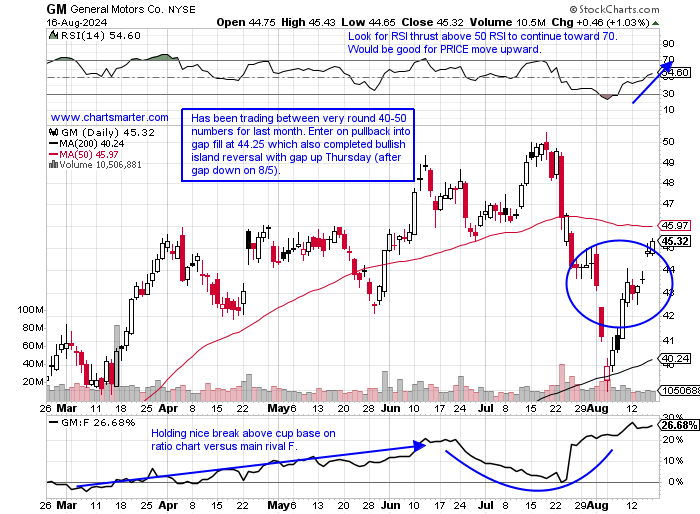
- Auto play up 26% YTD and 38% over last one year period. Dividend yield of 1.1%.
- Name 10% off most recent 52-week highs (rival F is 29% off its annual peak in comparison) and WEEKLY chart shows rapid reclaim of 200 WEEK SMA which was stern resistance throughout 2022-23. Nice action last week up 4.2% following through after prior weeks bullish piercing line candle off 50 WEEK SMA.
- Earnings reactions mixed up 4.4 and 7.8% on 4/23 and 1/30 and fell 6.4 and 2.2% on 7/23 and 10/24/23.
- Enter into gap fill which completed bullish island reversal.
- Entry GM 44.25. Stop 42.50.
- Good things take time and look at the reaction Tuesday after the stock reported earnings. Tuesday it shot up 10% and the stock has doubled in PRICE over the last one year. It broke above the very round 50 number (the fourth time was the charm breaking above pesky resistance there since mid-July) in an ascending triangle that carries a measured move to 61 and any pullback toward the 52 area should be bought.
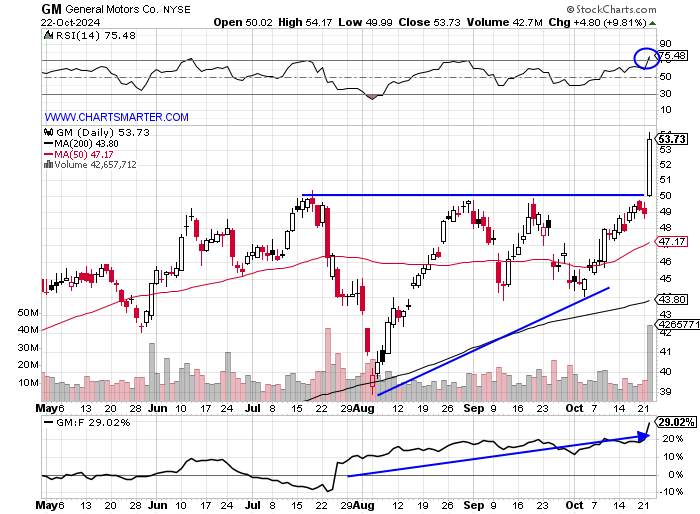
- Its MONTHLY chart shows the firm action since a break above a 42.92 double bottom pivot in March in a pattern more than 3 years in duration. Notice it was successfully retested in August and recorded a bullish hammer candle. I think this has a chance to hit the 65 level by year-end, a PRICE last touched in January 2022.

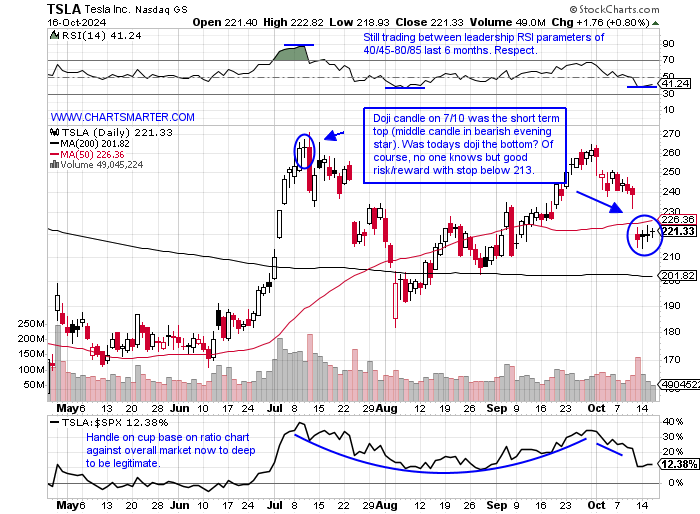
- Regarding TSLA, this is how it appeared in our 10/17 Consumer Note and not much has changed since. It continues to trade in a very taut fashion.
"Spinning" its Wheels:
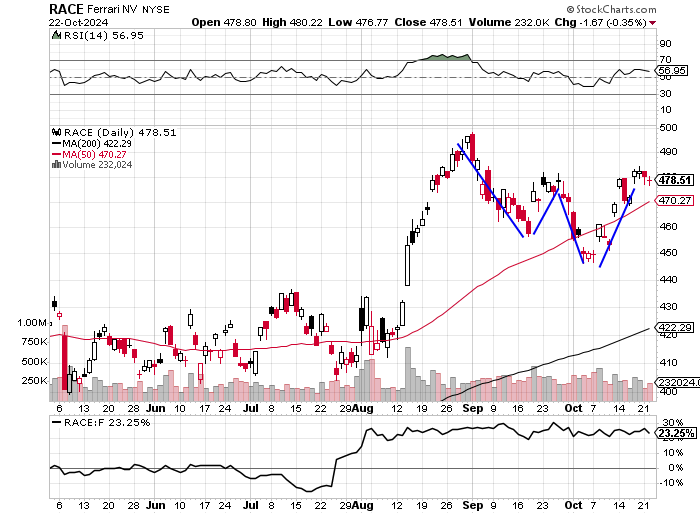
- There is not a more closely watched automobile play in the world than Tesla. To call in at auto-play is probably misleading as it is really a technology company. Some find its CEO a bit controversial and it may affect the PRICE sometimes but it looks like it may be trying to put in a short-term bottom here. I say this from the candles it has been recording the last few sessions with three consecutive spinning top candles, hence the headline reference, and Wednesday registered a doji candle. After a 50-handle PRICE decline since the end of Q3, these types of candles could signal selling fatigue and a change of trend in the prevailing direction which could mean better times are ahead for the name. Option activity is bullish, and the MONTHLY chart still shows the symmetrical triangle pattern in place. Others to watch in the space include RACE which has acted well since completing a bullish island reversal on 10/8 with the gap up (after the gap down on 10/3). Trouble began at the very round 500 number with a bearish engulfing candle on 9/3, but I think one can enter here and add to with a buy stop above a double bottom pivot of 481.48.
- Looking at RACE which was mentioned in that TSLA paragraph too, it is now right at the double bottom pivot of 481.48. This should feel a magnetic pull toward the very round 500 number in November. Consider this a best-of-breed automobile play although GM is threatening that statement. Notice how the ratio chart comparing them favors GM, and this was before this weeks advance, with RACE breaking BELOW a bull flag breakout so quickly in early September, a red flag.
Good luck.
This article requires a Chartsmarter membership. Please click here to join.
- For long-term investors, the old adage "buy low and sell high" does not always apply. Often they will buy high and sell higher. What this means is that the best stocks often offer add-on buy points on the way UP. As we await the earnings from TSLA after the CLOSE Wednesday afternoon GM already did so and it was impressive. Below is how we looked at the name in our 8/19 Consumer Note.
General Motors:
- Auto play up 26% YTD and 38% over last one year period. Dividend yield of 1.1%.
- Name 10% off most recent 52-week highs (rival F is 29% off its annual peak in comparison) and WEEKLY chart shows rapid reclaim of 200 WEEK SMA which was stern resistance throughout 2022-23. Nice action last week up 4.2% following through after prior weeks bullish piercing line candle off 50 WEEK SMA.
- Earnings reactions mixed up 4.4 and 7.8% on 4/23 and 1/30 and fell 6.4 and 2.2% on 7/23 and 10/24/23.
- Enter into gap fill which completed bullish island reversal.
- Entry GM 44.25. Stop 42.50.
- Good things take time and look at the reaction Tuesday after the stock reported earnings. Tuesday it shot up 10% and the stock has doubled in PRICE over the last one year. It broke above the very round 50 number (the fourth time was the charm breaking above pesky resistance there since mid-July) in an ascending triangle that carries a measured move to 61 and any pullback toward the 52 area should be bought.
- Its MONTHLY chart shows the firm action since a break above a 42.92 double bottom pivot in March in a pattern more than 3 years in duration. Notice it was successfully retested in August and recorded a bullish hammer candle. I think this has a chance to hit the 65 level by year-end, a PRICE last touched in January 2022.
- Regarding TSLA, this is how it appeared in our 10/17 Consumer Note and not much has changed since. It continues to trade in a very taut fashion.
"Spinning" its Wheels:
- There is not a more closely watched automobile play in the world than Tesla. To call in at auto-play is probably misleading as it is really a technology company. Some find its CEO a bit controversial and it may affect the PRICE sometimes but it looks like it may be trying to put in a short-term bottom here. I say this from the candles it has been recording the last few sessions with three consecutive spinning top candles, hence the headline reference, and Wednesday registered a doji candle. After a 50-handle PRICE decline since the end of Q3, these types of candles could signal selling fatigue and a change of trend in the prevailing direction which could mean better times are ahead for the name. Option activity is bullish, and the MONTHLY chart still shows the symmetrical triangle pattern in place. Others to watch in the space include RACE which has acted well since completing a bullish island reversal on 10/8 with the gap up (after the gap down on 10/3). Trouble began at the very round 500 number with a bearish engulfing candle on 9/3, but I think one can enter here and add to with a buy stop above a double bottom pivot of 481.48.
- Looking at RACE which was mentioned in that TSLA paragraph too, it is now right at the double bottom pivot of 481.48. This should feel a magnetic pull toward the very round 500 number in November. Consider this a best-of-breed automobile play although GM is threatening that statement. Notice how the ratio chart comparing them favors GM, and this was before this weeks advance, with RACE breaking BELOW a bull flag breakout so quickly in early September, a red flag.
Good luck.