Could It be Time to Add Intel to Your Portfolio?
- There is a rich history of stocks being deleted from the Dow which tend to outperform the name that replaced them. Will history repeat itself with INTC and NVDA with the big announcement after the CLOSE Friday? I am not here to suggest NVDA will be outshined by INTC over the next 12 months, rather to encourage one to look at the semi laggard in a positive light. Perhaps a barbell approach owning both. The MONTHLY chart below of INTC has a nice look if it can hold the very round 20 number. Both August and September traded with an 18 handle only to CLOSE with a 22 and 23 handle respectively, showing investors showed up at the level enthusiastically. Friday Intel recorded a nice earnings reaction up 8%, its first gain in its last 3 reports (the previous three slumped 26, 9, and 12%) and the DAILY chart here shows a logical move toward the upside gap fill at 29 from the 8/1 session. The WEEKLY chart still has plenty of repair to do but notice the big accumulation in September with the 3 weeks ending between 9/13-27 rising by a combined 25% in huge volume (the last 2 weeks of that streak were the heaviest WEEKLY volume in the last 5 years). The doji candle in October suggests overall selling pressure is abating too. Enter INTC at 22 and use a CLOSING stop of 19.75.

Software Mediocrity No More?
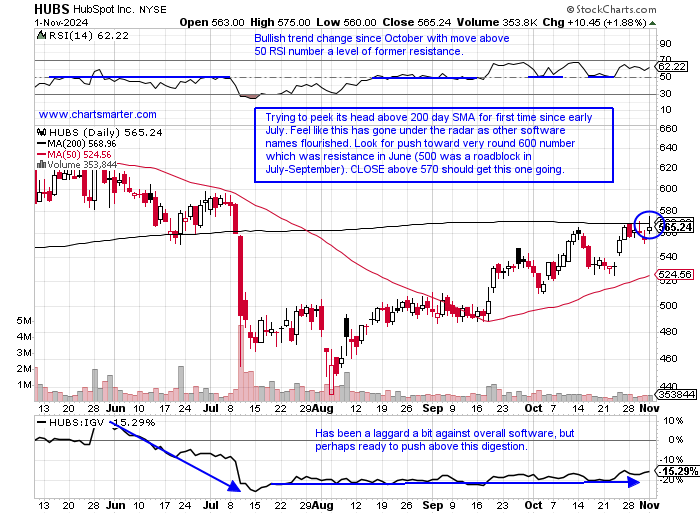
- Some of the higher PRICED software names are in some interesting spots. Below is the daily chart of HUBS and this is basically back to where it was when GOOGL announced in July that it was no longer pursuing an acquisition of the company. The last 6 sessions have played tug of war at the 200-day SMA, and on the WEEKLY chart since the bullish piercing line candle the week ending 8/9, it has acted well and is trying to distance itself from the 50 WEEK SMA as a double bottom base takes shape (notice how round number theory played a role at the very round 700 figure in April). Another name to keep an eye on is ACN which this week filled in the earnings-related gap from the 9/25 session. Notice Thursday and Friday recording spinning top candles with very small intraday ranges after Wednesday's 5% decline in heavy trade suggesting bears not having the firepower to follow through to the downside. The WEEKLY chart shows the possibility of a cup with handle but bulls do not want to see the handle get any deeper than it already is. Use a CLOSING stop of 334 if getting involved on the long side.

Recent Examples:
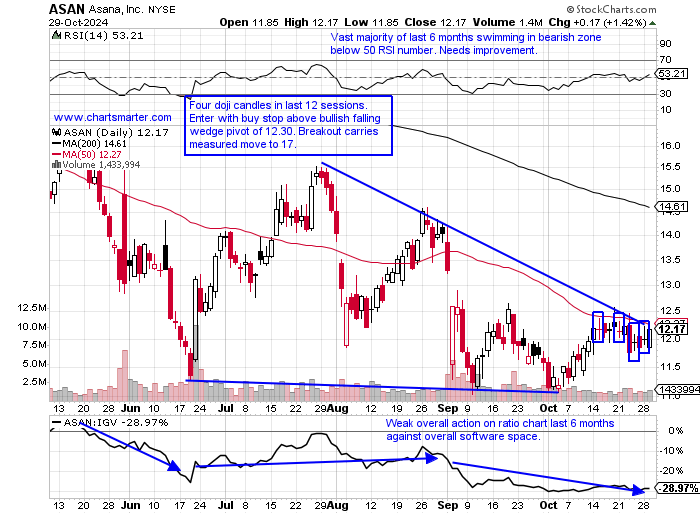
- As software shines overall some laggards are a good lesson in not marrying a stock. Below is a good example with the daily chart of ASAN and how it appeared in our 10/30 Technology Note. This name almost hit the very round 150 number back in November 2021 before recording a bearish engulfing candle that month falling 25% as seen here on the MONTHLY chart. Notice prior it was a very well-received new issue coming public in 2020 and screaming off the very round 20 number in November before rising more than 600% to its peak just one year later. Incredibly since the peak 3 years ago, it has advanced on a MONTHLY basis consecutive times just twice. I still think it offers good risk/reward here long with the double bottom. On the WEEKLY chart could it be breaking ABOVE a bearish rounded top pattern? The updated chart here shows a nice advance of 7% Friday breaking above a bullish falling wedge. Next likely stop is the upside gap fill from the 9/3 session, and when and if it gets there we could reassess.

Special Situations:
Microstrategy:
- Bitcoin software play up 264% YTD and 439% over last one year period.
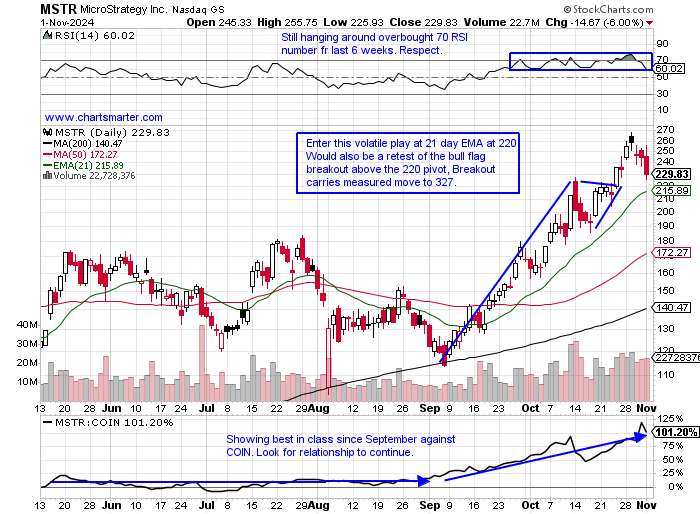
- Name 14% off most recent 52-week highs and MONTHLY chart shows the 45% move in October CLOSED near highs for the range breaking above bull flag pattern. Notice how very round par number was resistance in February 2021, and support in bull flag.
- Earnings reactions mostly lower off 1.1, 4.2, and 17.6% on 10/31, 8/2, and 4/30 after a gain of 2% on 2/7.
- Enter on pullback into 21-day EMA/bull flag breakout.
- Entry MSTR 220. Stop 195.

Parsons:
- Underappreciated tech play up 74% YTD and 78% over last one year period.
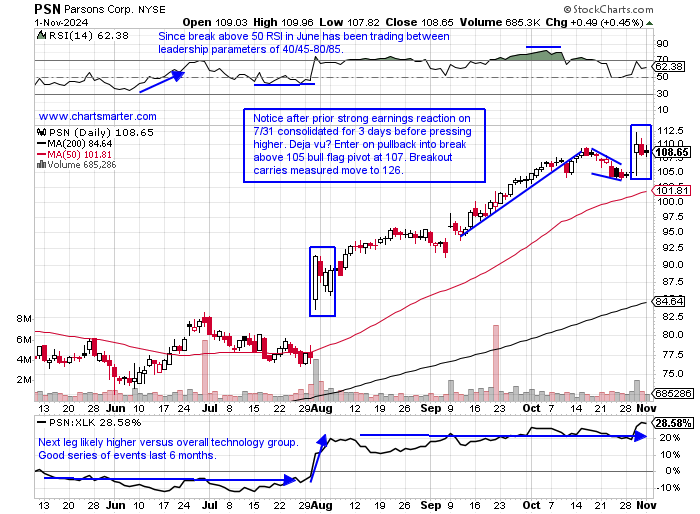
- Name 3% off most recent 52-week highs and MONTHLY chart shows advanced 15 of last 18 months (strong accumulation over streak) and notice for last one year RSI has been above overbought 70 number, showing overbought does not mean overdone.
- Earnings reactions mostly higher up 18.4, 7.3, and 8% on 10/30, 7/31, and 2/14 and fell 1.1% on 5/1.
- Enter on pullback into bull flag breakout.
- Entry PSN 107. Stop 101.

Doordash:
- Internet play up 57% YTD and 105% over last one year period.
- Name 6% off most recent 52-week highs and WEEKLY chart shows current 8-week win streak but could be fatigued with with last week's bearish gravestone doji candle. Think this retreats toward the former cup base breakout pivot 144.34 from last week of September.
- Earnings reactions mixed with gains of .9 and 8.3% on 10/31 and 8/2 and fell 10.3 and 8.1% on 5/2 and 2/16.
- Enter short into large bearish filled-in black candle.
- Entry DASH 159. Buy stop 166.

Good luck.
Entry summaries:
Buy pullback into 21-day EMA/bull flag breakout MSTR 220. Stop 195.
Buy pullback into bull flag breakout PSN 107. Stop 101.
Short into large bearish filled-in black candle DASH 159. Buy stop 166.
This article requires a Chartsmarter membership. Please click here to join.
Could It be Time to Add Intel to Your Portfolio?
- There is a rich history of stocks being deleted from the Dow which tend to outperform the name that replaced them. Will history repeat itself with INTC and NVDA with the big announcement after the CLOSE Friday? I am not here to suggest NVDA will be outshined by INTC over the next 12 months, rather to encourage one to look at the semi laggard in a positive light. Perhaps a barbell approach owning both. The MONTHLY chart below of INTC has a nice look if it can hold the very round 20 number. Both August and September traded with an 18 handle only to CLOSE with a 22 and 23 handle respectively, showing investors showed up at the level enthusiastically. Friday Intel recorded a nice earnings reaction up 8%, its first gain in its last 3 reports (the previous three slumped 26, 9, and 12%) and the DAILY chart here shows a logical move toward the upside gap fill at 29 from the 8/1 session. The WEEKLY chart still has plenty of repair to do but notice the big accumulation in September with the 3 weeks ending between 9/13-27 rising by a combined 25% in huge volume (the last 2 weeks of that streak were the heaviest WEEKLY volume in the last 5 years). The doji candle in October suggests overall selling pressure is abating too. Enter INTC at 22 and use a CLOSING stop of 19.75.

Software Mediocrity No More?
- Some of the higher PRICED software names are in some interesting spots. Below is the daily chart of HUBS and this is basically back to where it was when GOOGL announced in July that it was no longer pursuing an acquisition of the company. The last 6 sessions have played tug of war at the 200-day SMA, and on the WEEKLY chart since the bullish piercing line candle the week ending 8/9, it has acted well and is trying to distance itself from the 50 WEEK SMA as a double bottom base takes shape (notice how round number theory played a role at the very round 700 figure in April). Another name to keep an eye on is ACN which this week filled in the earnings-related gap from the 9/25 session. Notice Thursday and Friday recording spinning top candles with very small intraday ranges after Wednesday's 5% decline in heavy trade suggesting bears not having the firepower to follow through to the downside. The WEEKLY chart shows the possibility of a cup with handle but bulls do not want to see the handle get any deeper than it already is. Use a CLOSING stop of 334 if getting involved on the long side.

Recent Examples:
- As software shines overall some laggards are a good lesson in not marrying a stock. Below is a good example with the daily chart of ASAN and how it appeared in our 10/30 Technology Note. This name almost hit the very round 150 number back in November 2021 before recording a bearish engulfing candle that month falling 25% as seen here on the MONTHLY chart. Notice prior it was a very well-received new issue coming public in 2020 and screaming off the very round 20 number in November before rising more than 600% to its peak just one year later. Incredibly since the peak 3 years ago, it has advanced on a MONTHLY basis consecutive times just twice. I still think it offers good risk/reward here long with the double bottom. On the WEEKLY chart could it be breaking ABOVE a bearish rounded top pattern? The updated chart here shows a nice advance of 7% Friday breaking above a bullish falling wedge. Next likely stop is the upside gap fill from the 9/3 session, and when and if it gets there we could reassess.

Special Situations:
Microstrategy:
- Bitcoin software play up 264% YTD and 439% over last one year period.
- Name 14% off most recent 52-week highs and MONTHLY chart shows the 45% move in October CLOSED near highs for the range breaking above bull flag pattern. Notice how very round par number was resistance in February 2021, and support in bull flag.
- Earnings reactions mostly lower off 1.1, 4.2, and 17.6% on 10/31, 8/2, and 4/30 after a gain of 2% on 2/7.
- Enter on pullback into 21-day EMA/bull flag breakout.
- Entry MSTR 220. Stop 195.

Parsons:
- Underappreciated tech play up 74% YTD and 78% over last one year period.
- Name 3% off most recent 52-week highs and MONTHLY chart shows advanced 15 of last 18 months (strong accumulation over streak) and notice for last one year RSI has been above overbought 70 number, showing overbought does not mean overdone.
- Earnings reactions mostly higher up 18.4, 7.3, and 8% on 10/30, 7/31, and 2/14 and fell 1.1% on 5/1.
- Enter on pullback into bull flag breakout.
- Entry PSN 107. Stop 101.

Doordash:
- Internet play up 57% YTD and 105% over last one year period.
- Name 6% off most recent 52-week highs and WEEKLY chart shows current 8-week win streak but could be fatigued with with last week's bearish gravestone doji candle. Think this retreats toward the former cup base breakout pivot 144.34 from last week of September.
- Earnings reactions mixed with gains of .9 and 8.3% on 10/31 and 8/2 and fell 10.3 and 8.1% on 5/2 and 2/16.
- Enter short into large bearish filled-in black candle.
- Entry DASH 159. Buy stop 166.

Good luck.
Entry summaries:
Buy pullback into 21-day EMA/bull flag breakout MSTR 220. Stop 195.
Buy pullback into bull flag breakout PSN 107. Stop 101.
Short into large bearish filled-in black candle DASH 159. Buy stop 166.