Golden Goose:
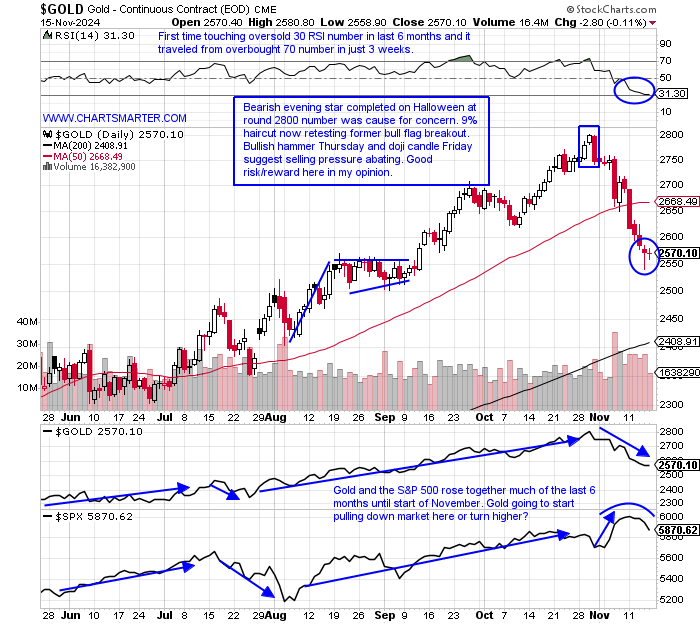
- Gold bugs have been splattered in the last few weeks and the decline has been anything but orderly. Volume has been robust as PRICE has fallen, and in November the precious metal has advanced just 2 sessions. The S&P 500 finally got the memo this week as it fell playing catch up to the soft-acting precious metal (one can see here the near-perfect correlation of 1 at the bottom of the chart almost every month at some point between June to October). I think Friday's doji candle, after Thursday's nice reversal higher, after a 250-handle move lower offers good risk/reward.
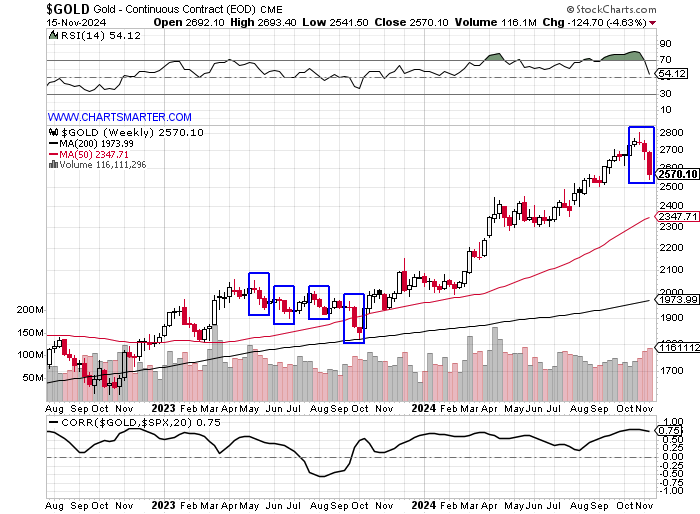
- On its WEEKLY chart, there was fair warning as well with the bearish gravestone doji candle the week ending 11/1 and notice this week completed gold's first 3-week losing streak in over one year. The good news for gold bulls is the last 4 times gold recorded a 3 week losing streak the metal went on to gain 2, 4, 2, and 4 weeks immediately following (all occurred in 2023 and boxed on chart). Truth be told it did not record meaningful ground and gold traded sideways until the bullish morning star was completed off the 200 WEEK SMA last October.
- The one chart that looks the most ominous is the MONTHLY chart halfway through November with a potential bearish evening star. There are still 2 weeks to rectify that but I still think risk/reward is on the long side here with a move to the very round 3000 number sometime in Q1 '25. It remains extended above the double bottom breakout at 2100 from March and one could have thought there were good things to come there as it also negated back-to-back doji candles this January-February (circled).

Good luck.
This article requires a Chartsmarter membership. Please click here to join.
Golden Goose:
- Gold bugs have been splattered in the last few weeks and the decline has been anything but orderly. Volume has been robust as PRICE has fallen, and in November the precious metal has advanced just 2 sessions. The S&P 500 finally got the memo this week as it fell playing catch up to the soft-acting precious metal (one can see here the near-perfect correlation of 1 at the bottom of the chart almost every month at some point between June to October). I think Friday's doji candle, after Thursday's nice reversal higher, after a 250-handle move lower offers good risk/reward.
- On its WEEKLY chart, there was fair warning as well with the bearish gravestone doji candle the week ending 11/1 and notice this week completed gold's first 3-week losing streak in over one year. The good news for gold bulls is the last 4 times gold recorded a 3 week losing streak the metal went on to gain 2, 4, 2, and 4 weeks immediately following (all occurred in 2023 and boxed on chart). Truth be told it did not record meaningful ground and gold traded sideways until the bullish morning star was completed off the 200 WEEK SMA last October.
- The one chart that looks the most ominous is the MONTHLY chart halfway through November with a potential bearish evening star. There are still 2 weeks to rectify that but I still think risk/reward is on the long side here with a move to the very round 3000 number sometime in Q1 '25. It remains extended above the double bottom breakout at 2100 from March and one could have thought there were good things to come there as it also negated back-to-back doji candles this January-February (circled).
Good luck.