Will the Real Semis Please Stand Up:
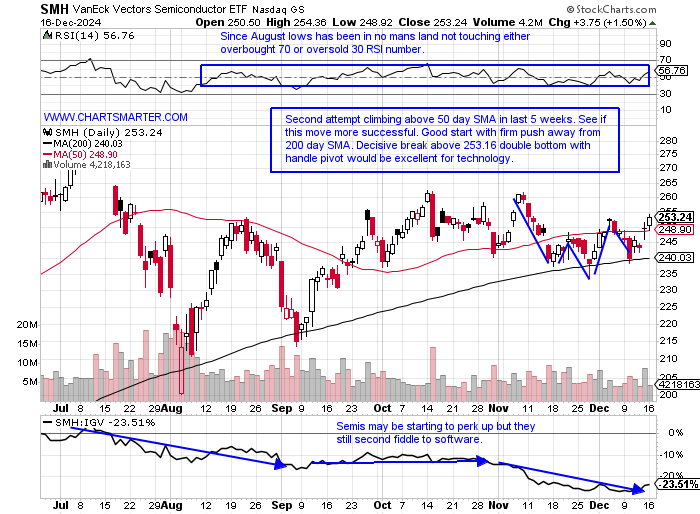
- There is some big bifurcation going on in the chip space. Does it make sense to play a barbell approach with leaders and laggards? We have witnessed some nice gap up after earnings for AVGO and MRVL for example, but others like AMD and NVDA are falling behind. The daily chart of the SMH shows overall the group seems to have a slight breeze behind its back. Will a stronger gale start to occur? It is right in the area of a double bottom with handle trigger and the SMH is holding up a bit better even with its huge NVDA weighting (21% compared to 9% in the SOXX). AVGO in the SMH makes up 10%, less than half that of the SOXX, and MRVL is not even a top ten component (MRVL carries a measured move to 144 from the bull flag breakout above 112). There still is a lot of dead weight within with QCOM going for a 7th consecutive MONTHLY loss (notice how the prior cup found nice support at the very round par number between 2022-23). NXPI is sputtering also going for a 7th straight MONTHLY decline and is now retesting a cup with handle breakout pivot of 218.87. At the expense of sounding like a broken record, MCHP is looking at its 7th MONTHLY loss in a row, after a rejection at the very round par number in May and a September doji candle could not help it (now more than 40% off its annual peak). Again paint the picture with either bias you want. Bulls will say SMH holding up despite all the roadkill. Time will tell.
Bottom Fishing:
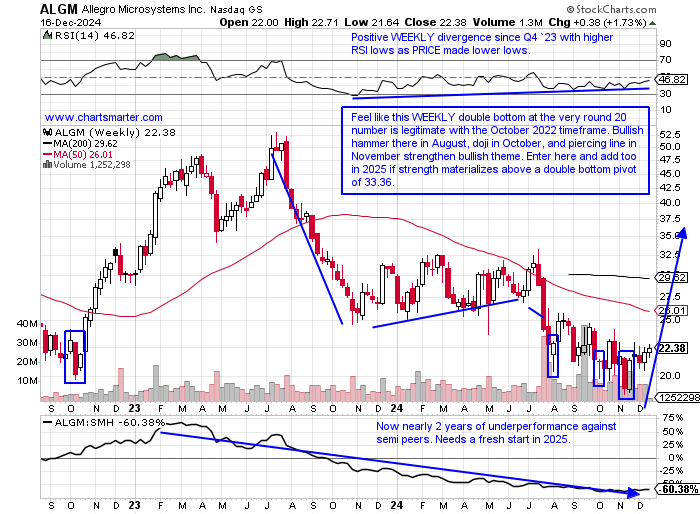
- In the semi-space there are laggards, which I would tend not to lend any credence too, but with tax selling taking place and the group perhaps ready for a shift higher, names that exhibit bullish technical factors deserve a long look. Below is the WEEKLY chart of ALGM which now trades 33% off its most recent 52-week highs, but the bulls feel like they won a tug of war at the very round 20 number, or at least provided a good area to play against with numerous positive candlesticks in the area. The daily chart here, although below the 200-day SMA has carved out a bullish inverse head and shoulders formation, and notice the fourth time climbing above the 50-day SMA may have been the charm, as the last 3 failed abruptly (the line is starting to gently curl upward too). A move above 23 neckline would carry a measured move toward 27 which would fill in the upside gap from the 7/23 session. On the MONTHLY chart, it has defended the 20 figure very well too, since November 2021, suggesting this level on multiple time frames should be a floor going forward. The November spinning top suggests selling pressure is abating. There has been some insider buying as well. Use a CLOSING stop below 19 if getting involved.
Recent Examples:
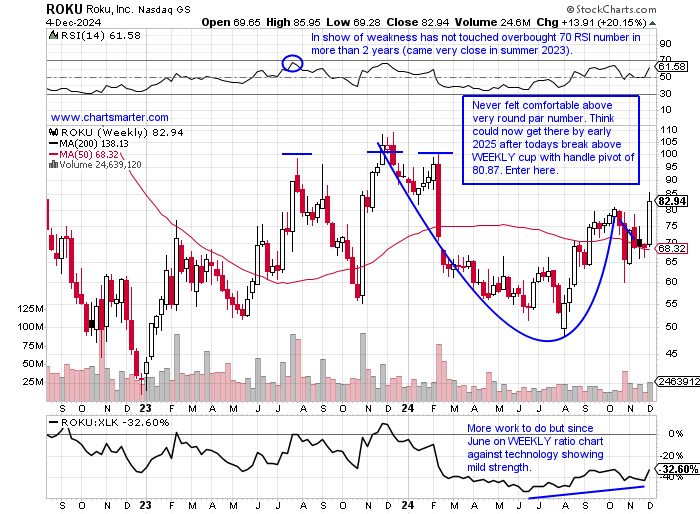
- The computer hardware group has seen some wild action, notably with DELL and LOGI slumping, with both 34 and 20% off their most recent respective 52-week highs. Others are looking better including the WEEKLY chart below of ROKU and how it appeared in our 12/5 Technology Note. The updated chart here shows the stock basically right near the suggested pivot but it is also taking the shape of a bull flag formation. A move above 85 carries a measured move to 104. Notice the round 80 number once a pesky level of resistance now looks like a floor. At least a good one to play against. Its WEEKLY chart shows how last week fell marginally by just more than 1%, but admire how it gave little back of the week priors gain of 21.9% in elevated volume, and remaining above the cup with handle. The MONTHLY chart shows the real possibility of a move toward the very round par number in a bullish ascending triangle. A break above 100 in 2025 would carry a measured move to 161. Continue to use a CLOSING stop of 79.
Special Situations:
Vertiv Holdings:
- Electronic components play up 162% YTD and 164% over last one year period. Dividend yield of .1%.
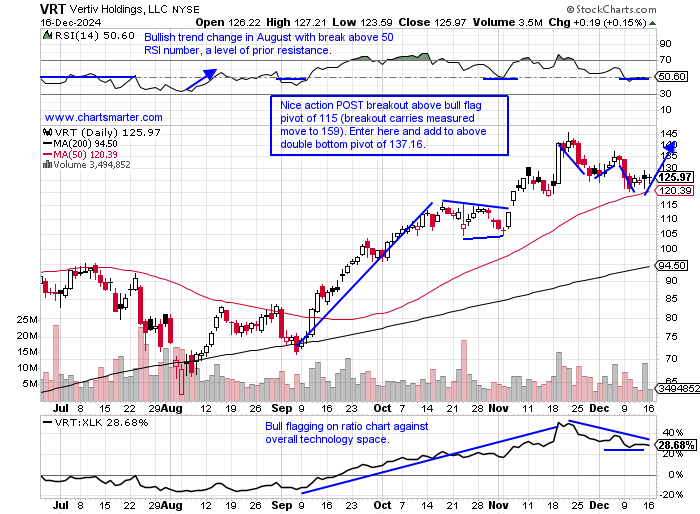
- Name 14% off most recent 52-week highs and former SPAC play (rare winner) on MONTHLY chart shows just 4 declines since the start of 2023. Nice action POST breakout near round 30 number and has since broke above bull flag.
- Earnings reactions mostly down off 3.7, 13.6, and 5.6% on 10/23, 7/24, and 2/21 and rose 6.8% on 5/15.
- Enter after first touch of rising 50-day SMA after recent breakout.
- Entry VRT here. Stop 118.
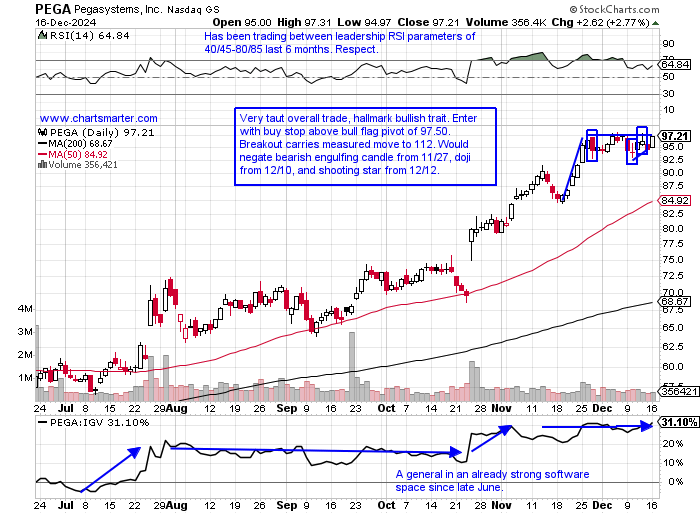
Pegasystems:
- Software play up 99% YTD and 95% over last one year period. Dividend yield of .1%.
- Name 2% off most recent 52-week highs and MONTHLY chart shows December going for a seventh consecutive win as October recaptured the 50-MONTH SMA. Cup base taking shape and no reason this can not potentially get to prior peak in late 2025 near 150.
- FOUR straight positive earnings reactions up 14.7, 12.8, .3, and 35.7% on 10/24, 7/25, 4/25 and 2/15.
- Enter with buy stop above bull flag.
- Entry PEGA 97.50. Stop 93.
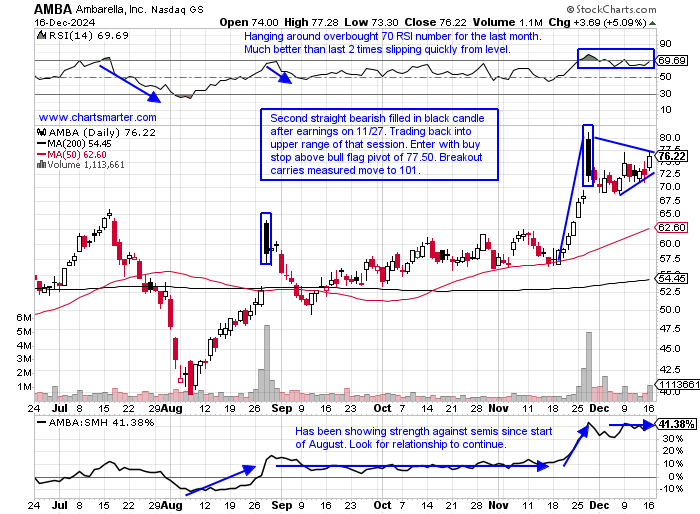
Ambarella:
- Semi play up 24% YTD and 19% over last one year period.
- Name 6% off most recent 52-week highs and MONTHLY chart shows when this gets going big things can happen. Above 50 MONTH SMA starts a double bottom base with a pivot right at the very round par number. Add to with buy stop above 99.96 trigger.
- FOUR straight positive earnings reactions up 5.9, 10.6, 20.6, and .1% on 11/27, 8/28, 5/31 and 2/28.
- Enter with buy stop above bull flag.
- Entry AMBA 77.50. Stop 72.
Good luck.
Entry summaries:
Buy after first touch of rising 50-day SMA after recent breakout VRT here. Stop 118.
Buy stop above bull flag PEGA 97.50. Stop 93.
Buy stop above bull flag AMBA 77.50. Stop 72.
This article requires a Chartsmarter membership. Please click here to join.
Will the Real Semis Please Stand Up:
- There is some big bifurcation going on in the chip space. Does it make sense to play a barbell approach with leaders and laggards? We have witnessed some nice gap up after earnings for AVGO and MRVL for example, but others like AMD and NVDA are falling behind. The daily chart of the SMH shows overall the group seems to have a slight breeze behind its back. Will a stronger gale start to occur? It is right in the area of a double bottom with handle trigger and the SMH is holding up a bit better even with its huge NVDA weighting (21% compared to 9% in the SOXX). AVGO in the SMH makes up 10%, less than half that of the SOXX, and MRVL is not even a top ten component (MRVL carries a measured move to 144 from the bull flag breakout above 112). There still is a lot of dead weight within with QCOM going for a 7th consecutive MONTHLY loss (notice how the prior cup found nice support at the very round par number between 2022-23). NXPI is sputtering also going for a 7th straight MONTHLY decline and is now retesting a cup with handle breakout pivot of 218.87. At the expense of sounding like a broken record, MCHP is looking at its 7th MONTHLY loss in a row, after a rejection at the very round par number in May and a September doji candle could not help it (now more than 40% off its annual peak). Again paint the picture with either bias you want. Bulls will say SMH holding up despite all the roadkill. Time will tell.

Bottom Fishing:
- In the semi-space there are laggards, which I would tend not to lend any credence too, but with tax selling taking place and the group perhaps ready for a shift higher, names that exhibit bullish technical factors deserve a long look. Below is the WEEKLY chart of ALGM which now trades 33% off its most recent 52-week highs, but the bulls feel like they won a tug of war at the very round 20 number, or at least provided a good area to play against with numerous positive candlesticks in the area. The daily chart here, although below the 200-day SMA has carved out a bullish inverse head and shoulders formation, and notice the fourth time climbing above the 50-day SMA may have been the charm, as the last 3 failed abruptly (the line is starting to gently curl upward too). A move above 23 neckline would carry a measured move toward 27 which would fill in the upside gap from the 7/23 session. On the MONTHLY chart, it has defended the 20 figure very well too, since November 2021, suggesting this level on multiple time frames should be a floor going forward. The November spinning top suggests selling pressure is abating. There has been some insider buying as well. Use a CLOSING stop below 19 if getting involved.

Recent Examples:
- The computer hardware group has seen some wild action, notably with DELL and LOGI slumping, with both 34 and 20% off their most recent respective 52-week highs. Others are looking better including the WEEKLY chart below of ROKU and how it appeared in our 12/5 Technology Note. The updated chart here shows the stock basically right near the suggested pivot but it is also taking the shape of a bull flag formation. A move above 85 carries a measured move to 104. Notice the round 80 number once a pesky level of resistance now looks like a floor. At least a good one to play against. Its WEEKLY chart shows how last week fell marginally by just more than 1%, but admire how it gave little back of the week priors gain of 21.9% in elevated volume, and remaining above the cup with handle. The MONTHLY chart shows the real possibility of a move toward the very round par number in a bullish ascending triangle. A break above 100 in 2025 would carry a measured move to 161. Continue to use a CLOSING stop of 79.

Special Situations:
Vertiv Holdings:
- Electronic components play up 162% YTD and 164% over last one year period. Dividend yield of .1%.
- Name 14% off most recent 52-week highs and former SPAC play (rare winner) on MONTHLY chart shows just 4 declines since the start of 2023. Nice action POST breakout near round 30 number and has since broke above bull flag.
- Earnings reactions mostly down off 3.7, 13.6, and 5.6% on 10/23, 7/24, and 2/21 and rose 6.8% on 5/15.
- Enter after first touch of rising 50-day SMA after recent breakout.
- Entry VRT here. Stop 118.

Pegasystems:
- Software play up 99% YTD and 95% over last one year period. Dividend yield of .1%.
- Name 2% off most recent 52-week highs and MONTHLY chart shows December going for a seventh consecutive win as October recaptured the 50-MONTH SMA. Cup base taking shape and no reason this can not potentially get to prior peak in late 2025 near 150.
- FOUR straight positive earnings reactions up 14.7, 12.8, .3, and 35.7% on 10/24, 7/25, 4/25 and 2/15.
- Enter with buy stop above bull flag.
- Entry PEGA 97.50. Stop 93.

Ambarella:
- Semi play up 24% YTD and 19% over last one year period.
- Name 6% off most recent 52-week highs and MONTHLY chart shows when this gets going big things can happen. Above 50 MONTH SMA starts a double bottom base with a pivot right at the very round par number. Add to with buy stop above 99.96 trigger.
- FOUR straight positive earnings reactions up 5.9, 10.6, 20.6, and .1% on 11/27, 8/28, 5/31 and 2/28.
- Enter with buy stop above bull flag.
- Entry AMBA 77.50. Stop 72.

Good luck.
Entry summaries:
Buy after first touch of rising 50-day SMA after recent breakout VRT here. Stop 118.
Buy stop above bull flag PEGA 97.50. Stop 93.
Buy stop above bull flag AMBA 77.50. Stop 72.