Nasdaq Travails:
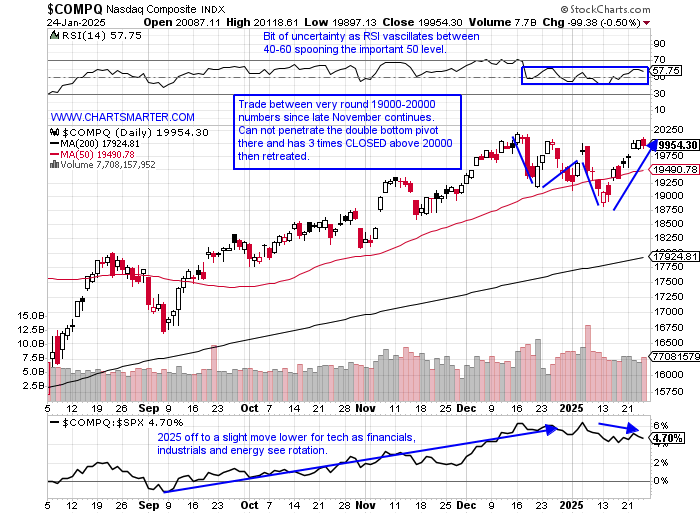
- Markets tend to bottom in a smooth, gradual, rounded fashion and top of volatile trade. The latter could be described as too what is going on currently with the Nasdaq. It is now finding difficulty at the very round 20000 number for the fourth time in just the last 6 weeks. Trade has been a bit wide and loose, hallmark bearish traits, and keep in mind the tech-heavy benchmark has doubled in PRICE since the consecutive doji candlesticks the first 2 weeks of 2023 (see my pinned tweet). Is fatigue setting in or at the very least does it need to continue to remain at this lofty altitude and trade sideways before a possible further advance? Remember I have stated that my belief was the Nasdaq would have trouble at 20000 due to the bearish MONTHLY shooting star candlestick in December, and we are now extended almost 30% above the 50 MONTH SMA. The stalling at the double bottom pivot on the daily chart below has to make one already cautious and the fact that next week starts a bevy of earnings, with AAPL META MSFT TSLA, and IBM all reporting adds to the concern. Mister Softee in my opinion has the best set-up after recently breaking above a double bottom pivot of 434.42. A move back toward that breakout and the gap fill from the 1/21 session should be bought by long-term shareholders.
Nvidia Teetering:
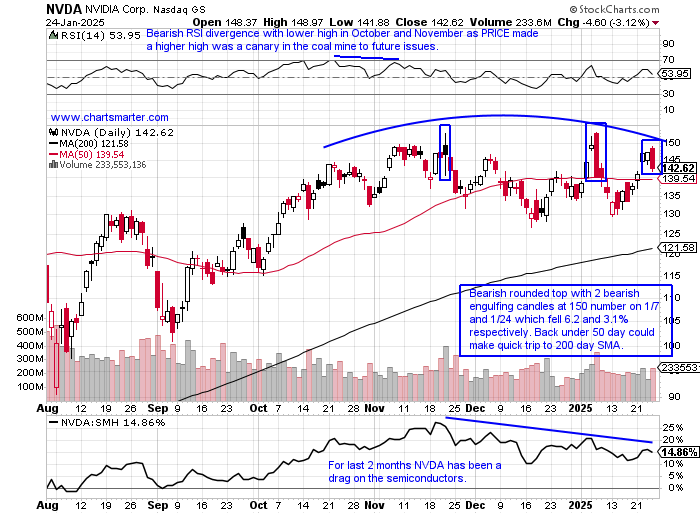
- The largest company on planet earth looks to be technically wounded. It has made very little progress since REPORTING earnings on 11/21, a day when it recorded a spinning top candle at the round 150 number. That session was its second-highest CLOSE ever and that uncertainty that candle produced has weighed on the name. The daily chart below shows the bearish rounded top playing out and Friday slipped more than 3% engulfing the two prior days. Its WEEKLY chart recorded a bearish shooting star last week and traded into the dark cloud cover candle from the week ending 1/10 that slumped 6% and CLOSED nearly 20 handles off its intraweek high. The MONTHLY chart has registered consecutive spinning tops in November and December and more dubious candles since last June. Notice since last August volume has shrunk with each successive month. Is that a function of less institutional involvement or long-term holders reluctant to part with their holdings? I think the former, and continuing with the cautious tone in the opening parargraph, one has to be open-minded as it seems bears are giddy, bulls nervous and no one is factoring in a possible melt-up. Still, I feel that NVDA can be shorted and look for a move to 130 in the near term and then perhaps to the 200-day SMA.
Recent Examples:
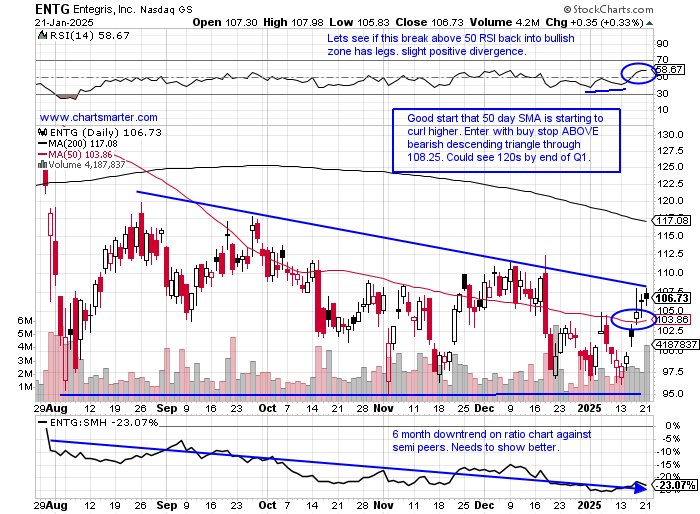
- We always capitalize the word CLOSE in our work all the time as a PRICE confirmation tool. Often an idea will be above a long, or below a short intraday, but unable to finish above it. That is a red flag for the suggestion. A good example of that would be the daily chart below of ENTG and how it appeared in our 1/22 Technology Note. For starters, this has been a laggard within the semiconductors and therefore should have been regarded in a lukewarm fashion. Round number theory had been coming into play with the name as it attempted to fortify above par. A bearish descending triangle had taken shape and we thought a break ABOVE it could lead to a powerful advance, as from FALSE moves can come fast ones in the opposite direction. It did pierce above the suggested 108.25 entry intraday on 1/22 as seen here, but ended up recording a bearish shooting star reversing and CLOSING near lows for the session. It ended up losing a combined 3% Thursday and Friday, and although this may work out in the future there are better fish to fry going forward.
Special Situations:
Arista Networks:
- Computer hardware play up 17% YTD and 95% over last one year period.
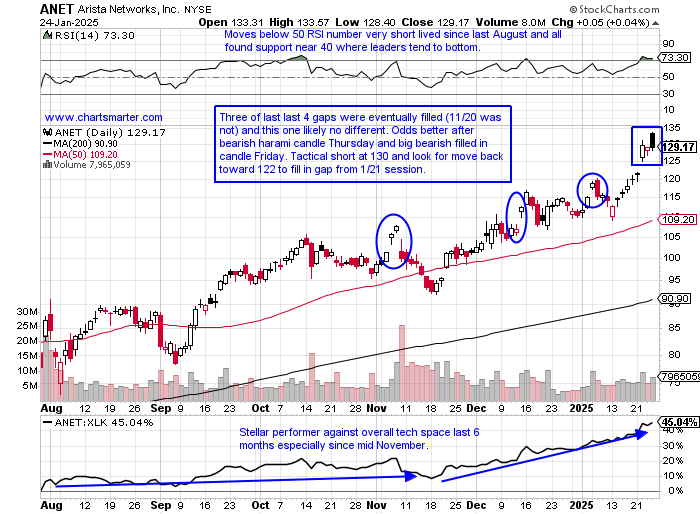
- Name 3% off most recent 52-week highs and MONTHLY chart shows name going for 6th straight advance and notice during this streak it has ignored two doji candles in August and October (and a spinning top in July). Consider this a tactical short and cover and go long near 120.
- Earnings reactions mixed up 11.3 and 6.4% on 7/31 and 5/8 and fell 7.1 and 5.5% on 11/8 and 2/13.
- Enter short after bearish harami/filled-in black candlestick.
- Entry ANET 130. Buy stop 134.
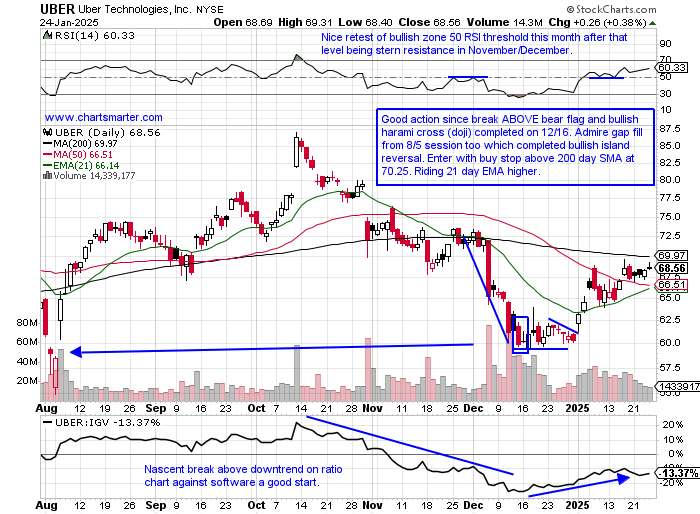
Uber:
- Software play up 14% YTD and 4% over last one year period.
- Name 21% off most recent 52-week highs and WEEKLY chart shows retest of bullish engulfing candle week ending 8/9 that rose 16%. Current 6-week win streak began with 2 spinning tops the weeks ending 12/20-27 after back-to-back big WEEKLY losses of 17.5% the weeks ending 12/6-23.
- Earnings reactions mixed up 10.9 and .3% on 8/6 and 2/7 and fell 9.3 and 5.7% on 10/31 and 5/8.
- Enter with buy stop above 200-day SMA.
- Entry UBER 70.25. Stop 67 (REPORTS 2/5 before open).
Netease:
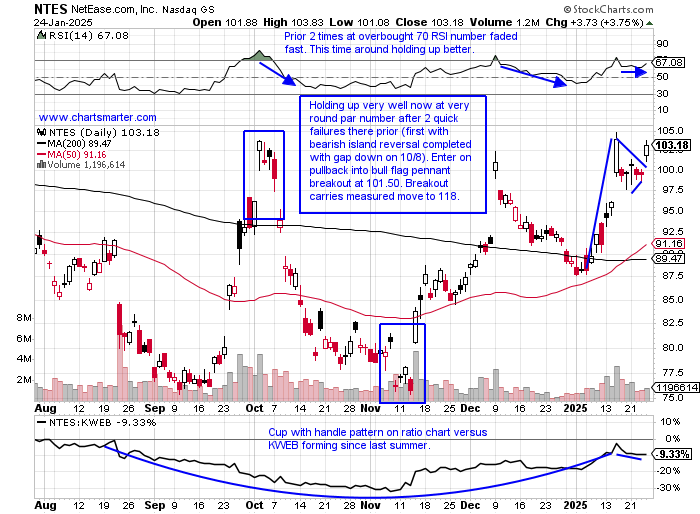
- Chinese communication services play (tech) up 16% YTD and UNCH over last one year period. Dividend yield of 2.4%.
- Name 10% off most recent 52-week highs and WEEKLY chart shows nice CLOSE in upper half of WEEKLY range last week, and finishing above 5 prior lower highs dating back to late 2023 (notice week ending 9/14 called the bottom with doji candle).
- Earnings reactions mostly lower off 11.2, 3.7, and 3.9% on 8/22, 5/23, and 2/29 before a gain of 10.4% on 11/14.
- Enter on pullback into bull pennant breakout.
- Entry NTES 101.50. Stop 98.
Good luck.
Entry summaries:
Short after bearish harami/filled-in black candlestick ANET 130. Buy stop 134.
Buy stop above 200-day SMA UBER 70.25. Stop 67.
Buy pullback into bull pennant breakout NTES 101.50. Stop 98.
This article requires a Chartsmarter membership. Please click here to join.
Nasdaq Travails:
- Markets tend to bottom in a smooth, gradual, rounded fashion and top of volatile trade. The latter could be described as too what is going on currently with the Nasdaq. It is now finding difficulty at the very round 20000 number for the fourth time in just the last 6 weeks. Trade has been a bit wide and loose, hallmark bearish traits, and keep in mind the tech-heavy benchmark has doubled in PRICE since the consecutive doji candlesticks the first 2 weeks of 2023 (see my pinned tweet). Is fatigue setting in or at the very least does it need to continue to remain at this lofty altitude and trade sideways before a possible further advance? Remember I have stated that my belief was the Nasdaq would have trouble at 20000 due to the bearish MONTHLY shooting star candlestick in December, and we are now extended almost 30% above the 50 MONTH SMA. The stalling at the double bottom pivot on the daily chart below has to make one already cautious and the fact that next week starts a bevy of earnings, with AAPL META MSFT TSLA, and IBM all reporting adds to the concern. Mister Softee in my opinion has the best set-up after recently breaking above a double bottom pivot of 434.42. A move back toward that breakout and the gap fill from the 1/21 session should be bought by long-term shareholders.

Nvidia Teetering:
- The largest company on planet earth looks to be technically wounded. It has made very little progress since REPORTING earnings on 11/21, a day when it recorded a spinning top candle at the round 150 number. That session was its second-highest CLOSE ever and that uncertainty that candle produced has weighed on the name. The daily chart below shows the bearish rounded top playing out and Friday slipped more than 3% engulfing the two prior days. Its WEEKLY chart recorded a bearish shooting star last week and traded into the dark cloud cover candle from the week ending 1/10 that slumped 6% and CLOSED nearly 20 handles off its intraweek high. The MONTHLY chart has registered consecutive spinning tops in November and December and more dubious candles since last June. Notice since last August volume has shrunk with each successive month. Is that a function of less institutional involvement or long-term holders reluctant to part with their holdings? I think the former, and continuing with the cautious tone in the opening parargraph, one has to be open-minded as it seems bears are giddy, bulls nervous and no one is factoring in a possible melt-up. Still, I feel that NVDA can be shorted and look for a move to 130 in the near term and then perhaps to the 200-day SMA.

Recent Examples:
- We always capitalize the word CLOSE in our work all the time as a PRICE confirmation tool. Often an idea will be above a long, or below a short intraday, but unable to finish above it. That is a red flag for the suggestion. A good example of that would be the daily chart below of ENTG and how it appeared in our 1/22 Technology Note. For starters, this has been a laggard within the semiconductors and therefore should have been regarded in a lukewarm fashion. Round number theory had been coming into play with the name as it attempted to fortify above par. A bearish descending triangle had taken shape and we thought a break ABOVE it could lead to a powerful advance, as from FALSE moves can come fast ones in the opposite direction. It did pierce above the suggested 108.25 entry intraday on 1/22 as seen here, but ended up recording a bearish shooting star reversing and CLOSING near lows for the session. It ended up losing a combined 3% Thursday and Friday, and although this may work out in the future there are better fish to fry going forward.

Special Situations:
Arista Networks:
- Computer hardware play up 17% YTD and 95% over last one year period.
- Name 3% off most recent 52-week highs and MONTHLY chart shows name going for 6th straight advance and notice during this streak it has ignored two doji candles in August and October (and a spinning top in July). Consider this a tactical short and cover and go long near 120.
- Earnings reactions mixed up 11.3 and 6.4% on 7/31 and 5/8 and fell 7.1 and 5.5% on 11/8 and 2/13.
- Enter short after bearish harami/filled-in black candlestick.
- Entry ANET 130. Buy stop 134.

Uber:
- Software play up 14% YTD and 4% over last one year period.
- Name 21% off most recent 52-week highs and WEEKLY chart shows retest of bullish engulfing candle week ending 8/9 that rose 16%. Current 6-week win streak began with 2 spinning tops the weeks ending 12/20-27 after back-to-back big WEEKLY losses of 17.5% the weeks ending 12/6-23.
- Earnings reactions mixed up 10.9 and .3% on 8/6 and 2/7 and fell 9.3 and 5.7% on 10/31 and 5/8.
- Enter with buy stop above 200-day SMA.
- Entry UBER 70.25. Stop 67 (REPORTS 2/5 before open).

Netease:
- Chinese communication services play (tech) up 16% YTD and UNCH over last one year period. Dividend yield of 2.4%.
- Name 10% off most recent 52-week highs and WEEKLY chart shows nice CLOSE in upper half of WEEKLY range last week, and finishing above 5 prior lower highs dating back to late 2023 (notice week ending 9/14 called the bottom with doji candle).
- Earnings reactions mostly lower off 11.2, 3.7, and 3.9% on 8/22, 5/23, and 2/29 before a gain of 10.4% on 11/14.
- Enter on pullback into bull pennant breakout.
- Entry NTES 101.50. Stop 98.

Good luck.
Entry summaries:
Short after bearish harami/filled-in black candlestick ANET 130. Buy stop 134.
Buy stop above 200-day SMA UBER 70.25. Stop 67.
Buy pullback into bull pennant breakout NTES 101.50. Stop 98.