The Persuasive Doji:
- As markets continue the climb the "wall of worry" many participants are nervous. One can sense it with sentiment after the latest AAII reading last week. I think this ascent will continue and there will be clues given along the way. The rare doji candle (which occurs when the opening and CLOSING PRICE are precisely the same), which speaks of indecision, is a good place to start. When these appear at near-term highs or lows that can be a good area to play against on the long side after a protracted decline, or the short side after a robust advance. They are adept at signaling a potential change in the prevailing direction. While there are many other things to consider the doji is something that investors should proceed with caution after one has been recorded. Let's take a look at a few examples below.
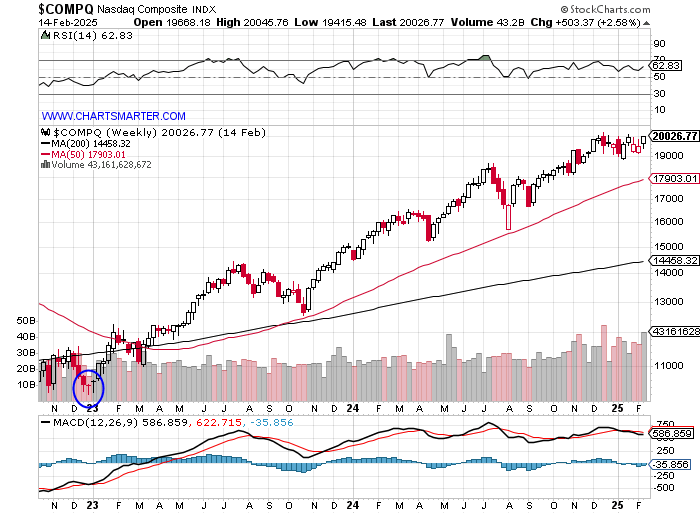
Nasdaq:
- Notice hear the Nasdaq doubled in PRICE since the rare WEEKLY dojis (they were the only dojis in the last 2 plus years) which were registered in back-to-back weeks with the last week of 2022 and first week of 2023 at the very round 10000 number. It was a good indication of risk-on coming back and notice the tech-heavy index has doubled since to 20000. Notice on the MONTHLY chart the only doji (gravestone) since the COVID era was at the 16000 area in November 2021 which sent the benchmark to 10000 two years later where it floored.
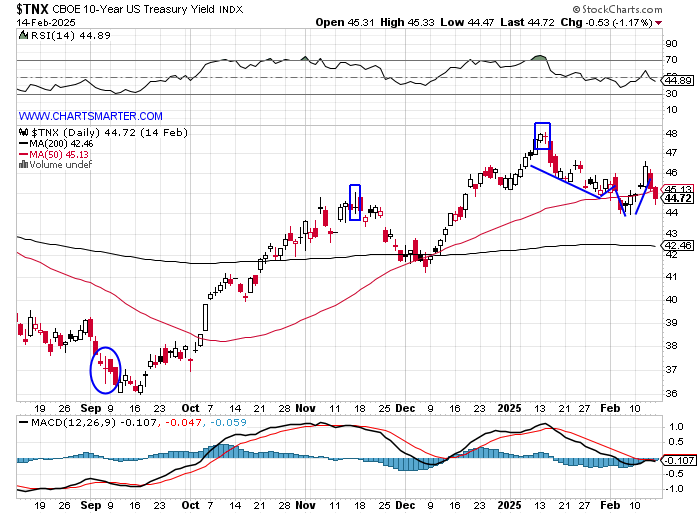
Ten-Year Yield:
- Below is the daily chart of the ten-year yield and one can see how the doji played a role with the potential bottom on 9/6 (circled) and it came several sessions later. On 11/15 another one was recorded and that led to a quick 40 basis point move lower. The doji on 1/14 was also a bearish harami cross and has given equity markets a boost since and the quick failure with last Wednesday's break above a double bottom near 4.6% is a red flag.
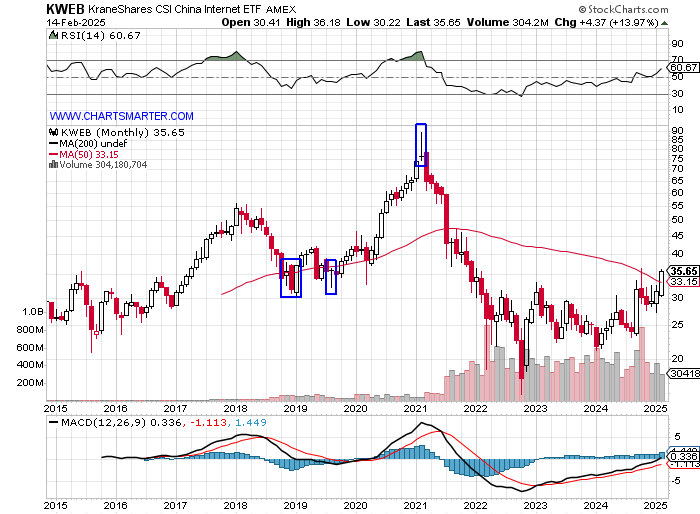
KWEB:
- China has been dominating financial headlines and below is the MONTHLY chart of the KWEB, and notice how a rare doji candle (gravestone) was recorded in February 2021 right at the very round 90 number. It plunged to a low of 15 in October 2022 before it started to slowly floor. That was preceded by a bullish dragonfly doji in August 2019 that cut into the big bullish engulfing candle from January 2019 adding to the sanguine theme. Notice so far in February it is moving above its 50 MONTH SMA for the first time since the summer of 2021.
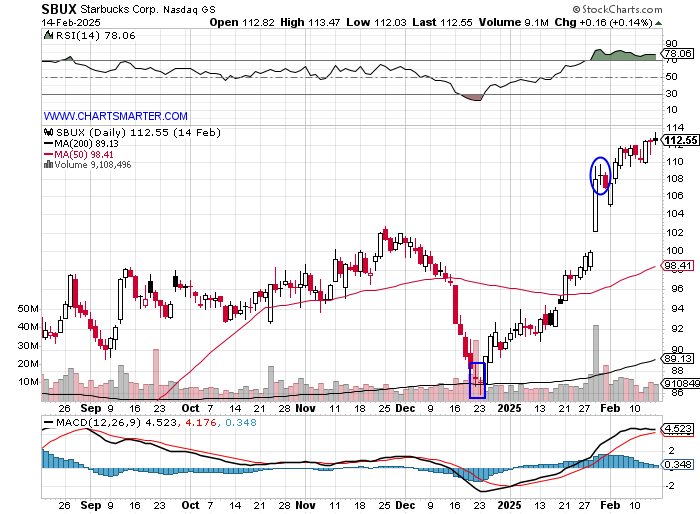
SBUX:
- The casual diner SBUX has been in the news with the high-profile CEO change last August, and this name put in a bottom on 12/23 with the doji candle on 12/23 right at the 200-day SMA. It recorded another one on 1/30 the day after a spirited earnings-related advance of 8.1%. The fact that the stock is continuing to move higher despite it could be a tell that PRICE will likely keep advancing into 2025. Additionally notice RSI has been above the overbought 70 number since that candle and we know there is nothing more bullish than an overbought situation that remains that way.
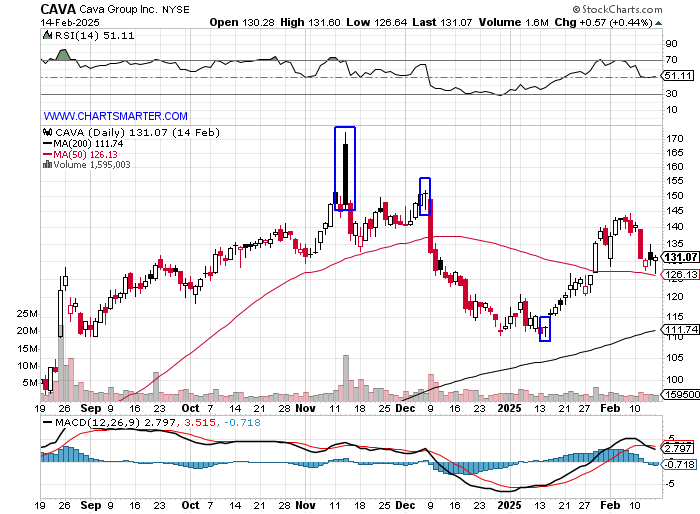
CAVA:
- Yet another strong casual diner overall in CAVA has been influenced by the doji candle. On 1/14 it put in a doji near 110 and rallied 35 points. It is possible the recent action is a handle on a cup base and Friday's bullish hammer at the 50-day SMA is a good area to play against on the long side. Notice the doji on 11/13 which cut into the large filled-in black candle from its last earnings reaction on 11/13 which CLOSED 25 handles off its intraday high was a good place to be cautious and the stock did respond lower.
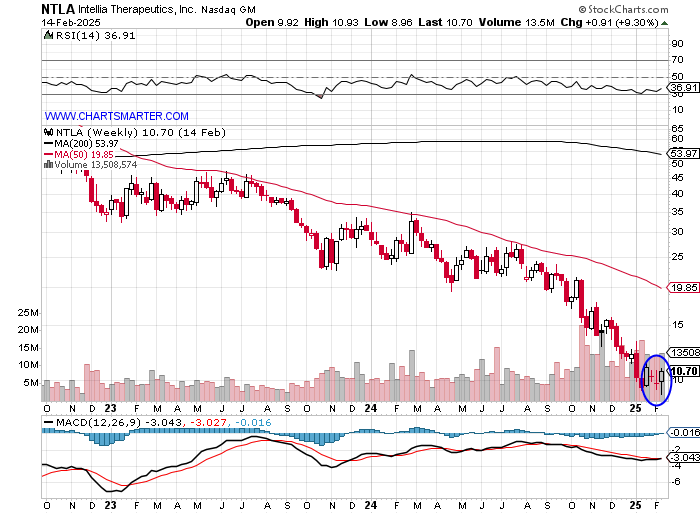
NTLA:
- With all the rage coming back to Cathy Woods many are peering into her holdings in the ARKG, many of which have been acting powerfully. Below is the WEEKLY chart of NTLA (REPORTS this Thursday before the open) and although I am not a bottom feeder, this name could be putting in a low here with back-to-back doji candles the weeks ending 1/31 and 2/7 (the only ones in at least the last 2 years). Round number theory is coming into play at the very round 10 figure and once can see the positive RSI divergence on the daily chart here. Treat this as pure speculation.
Good luck.
This should not be construed as investment advice.
This article requires a Chartsmarter membership. Please click here to join.
The Persuasive Doji:
- As markets continue the climb the "wall of worry" many participants are nervous. One can sense it with sentiment after the latest AAII reading last week. I think this ascent will continue and there will be clues given along the way. The rare doji candle (which occurs when the opening and CLOSING PRICE are precisely the same), which speaks of indecision, is a good place to start. When these appear at near-term highs or lows that can be a good area to play against on the long side after a protracted decline, or the short side after a robust advance. They are adept at signaling a potential change in the prevailing direction. While there are many other things to consider the doji is something that investors should proceed with caution after one has been recorded. Let's take a look at a few examples below.
Nasdaq:
- Notice hear the Nasdaq doubled in PRICE since the rare WEEKLY dojis (they were the only dojis in the last 2 plus years) which were registered in back-to-back weeks with the last week of 2022 and first week of 2023 at the very round 10000 number. It was a good indication of risk-on coming back and notice the tech-heavy index has doubled since to 20000. Notice on the MONTHLY chart the only doji (gravestone) since the COVID era was at the 16000 area in November 2021 which sent the benchmark to 10000 two years later where it floored.
Ten-Year Yield:
- Below is the daily chart of the ten-year yield and one can see how the doji played a role with the potential bottom on 9/6 (circled) and it came several sessions later. On 11/15 another one was recorded and that led to a quick 40 basis point move lower. The doji on 1/14 was also a bearish harami cross and has given equity markets a boost since and the quick failure with last Wednesday's break above a double bottom near 4.6% is a red flag.
KWEB:
- China has been dominating financial headlines and below is the MONTHLY chart of the KWEB, and notice how a rare doji candle (gravestone) was recorded in February 2021 right at the very round 90 number. It plunged to a low of 15 in October 2022 before it started to slowly floor. That was preceded by a bullish dragonfly doji in August 2019 that cut into the big bullish engulfing candle from January 2019 adding to the sanguine theme. Notice so far in February it is moving above its 50 MONTH SMA for the first time since the summer of 2021.
SBUX:
- The casual diner SBUX has been in the news with the high-profile CEO change last August, and this name put in a bottom on 12/23 with the doji candle on 12/23 right at the 200-day SMA. It recorded another one on 1/30 the day after a spirited earnings-related advance of 8.1%. The fact that the stock is continuing to move higher despite it could be a tell that PRICE will likely keep advancing into 2025. Additionally notice RSI has been above the overbought 70 number since that candle and we know there is nothing more bullish than an overbought situation that remains that way.
CAVA:
- Yet another strong casual diner overall in CAVA has been influenced by the doji candle. On 1/14 it put in a doji near 110 and rallied 35 points. It is possible the recent action is a handle on a cup base and Friday's bullish hammer at the 50-day SMA is a good area to play against on the long side. Notice the doji on 11/13 which cut into the large filled-in black candle from its last earnings reaction on 11/13 which CLOSED 25 handles off its intraday high was a good place to be cautious and the stock did respond lower.
NTLA:
- With all the rage coming back to Cathy Woods many are peering into her holdings in the ARKG, many of which have been acting powerfully. Below is the WEEKLY chart of NTLA (REPORTS this Thursday before the open) and although I am not a bottom feeder, this name could be putting in a low here with back-to-back doji candles the weeks ending 1/31 and 2/7 (the only ones in at least the last 2 years). Round number theory is coming into play at the very round 10 figure and once can see the positive RSI divergence on the daily chart here. Treat this as pure speculation.
Good luck.
This should not be construed as investment advice.