Not Recessionary Behavior:
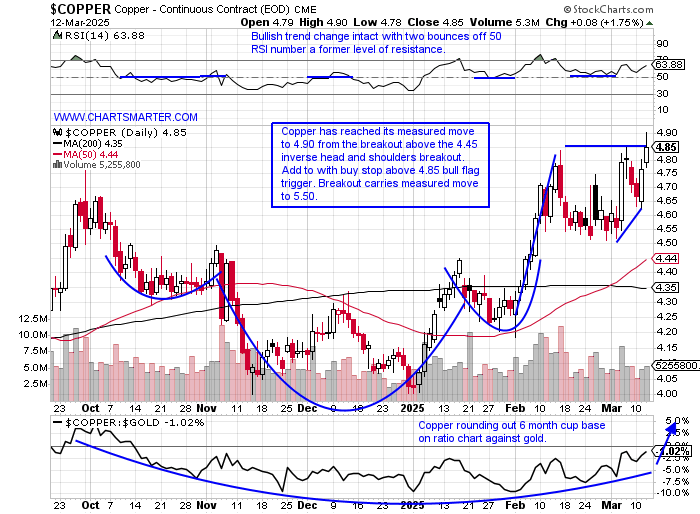
- Is copper strength signaling that a recession is not in the near-term future, or is it forecasting continued China firmness? That is a question for those who try and look smart. We are just trying to make money, and the daily chart below shows how leading instruments will offer add-on buy points on the way UP, contrary to popular opinion. As well, we know the best breakouts tend to work right away and that occurred with the move above 4.45 and now is sporting a bull flag formation. Notice the double bottom at 4 with a bullish hammer on 11/14, and the completion of a morning star on 1/3, and the golden cross from the beginning of March. The MONTHLY chart has a sanguine look with a bull flag that started at the COVID era lows right at the "round" $2. A CLOSE above a 4.75 pivot in March would be the first in the last decade and could carry a measured move to 6.50. There were 6 months that traded above 4.75 intramonth dating back to May 2021 but ZERO of them finished above 4.75 (March 2022 CLOSED right at 4.75).
Golden Roadblock?
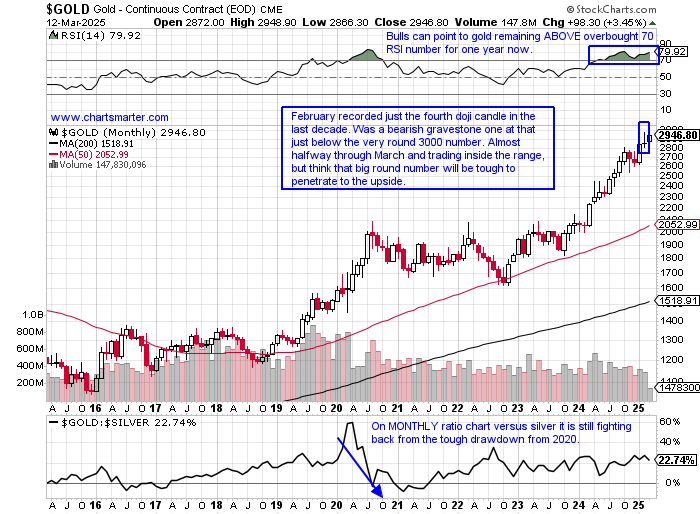
- Doji candles are a rare occurrence and when they pop up one should take notice (we wrote about that candle here). It is not a panacea inside the technical analysis toolbox but it is a pretty reliable candle, especially when it occurs at an extreme area with PRICE near a potential exhaustion area on the up or downside. Often it will signal a possible trend change from the prevailing direction. With the MONTHLY chart of Gold below one can see the doji from last month right at the very round 3000 number. I think one can play this short with a tight stop above the figure, as we know vehicles that ignore these dubious candles should be considered very bullish. Gold has not recorded a 3-month losing streak since Q3 '23 but I think this could be purchased at a better basis and notice it is 900 handles above its 50 MONTH SMA. On the WEEKLY chart, the last week of October 2024 recorded a bearish gravestone doji as well and led to a 2500-point decline, and 2 weeks back it registered a bearish engulfing candle to put an end to an 8-week win streak. It is plausible we could see a move back to 2800, the top of that doji candle in October, before a nice push higher in the second half.
Recent Examples:
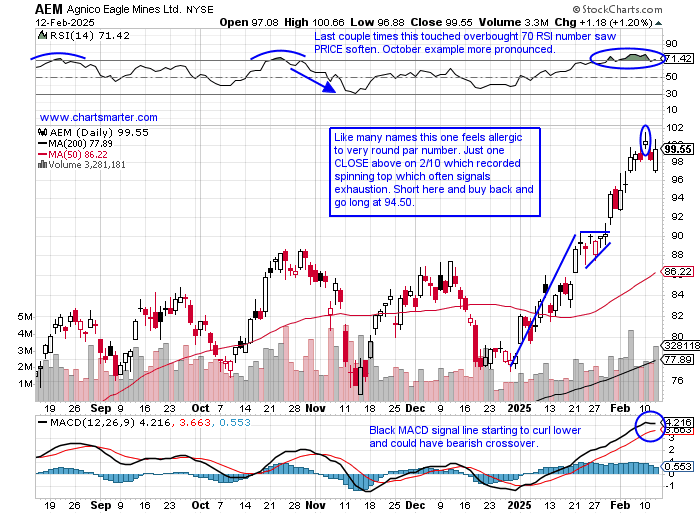
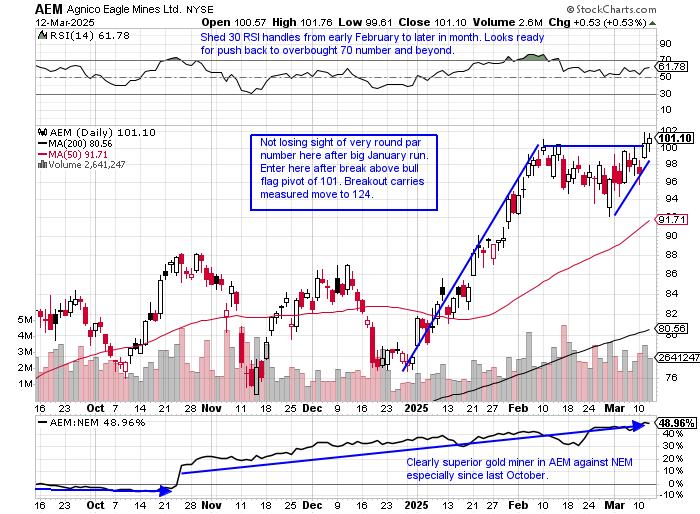
- The gold miners and the metal itself have been trading in tandem since last November, but that was not always the case as one can see how far apart they were last September and October as the miners were strongly outperforming. Now it is the opposite with the metal leading the way, if only fractionally here. The generals in the miner space are GFI and AGI. The former is now just above a 19.06 cup base pivot and is now dealing with the very round 20 number as it attempts to shed teenager status. Alamos Gold is trading well too and its WEEKLY chart shows it shrugging off back-to-back doji candles the weeks ending 2/21-28 as it charges higher looking to achieve a 12-week win streak this Friday, not a typo. Below is a leader to round out the trifecta with the daily chart of AEM and how it appeared in our 2/13 Materials Note. We will cover this name later in this note but it was a nice tactical trade and the fact that it is back at the very round par number so quickly after being rejected is bullish.
Special Situations:
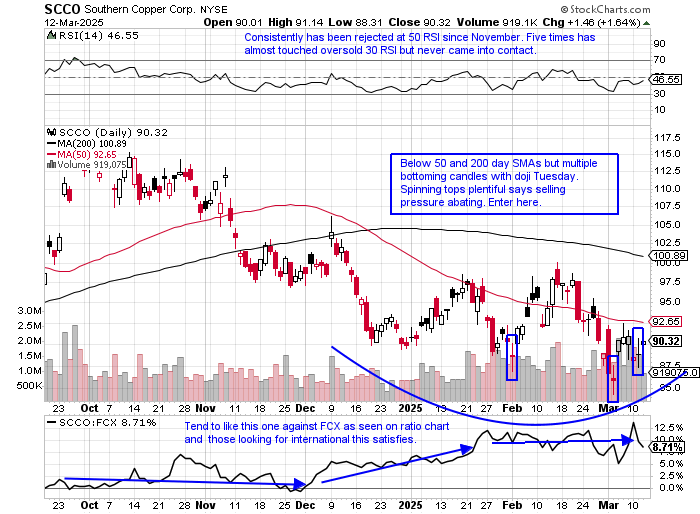
Southern Copper:
- Copper UNCH YTD and up 7% over last one year period. Dividend yield of 2.2%.
- Name 29% off most recent 52-week highs and WEEKLY chart shows how for at least 2 years has been outshining rival FCX. Last week recorded bullish hammer candle that retested prior bull flag breakout from one year ago. Potential double bottom trigger of 118.38 setting up.
- FOUR staight positive earnings reactions up 1.4, 1.9, .3, and 2.4% on 1/30, 10/22, 7/19 and 4/25/24.
- Enter after doji candle.
- Entry SCCO here. Stop 84.
Agnico Mines:
- Canadian best-in-breed gold miner 29% YTD and 83% over last one year period. Dividend yield of 1.6%.
- Name 1% off most recent 52-week highs and MONTHLY chart shows trong action continuing after cup base breakout above 79.04 trigger. Notice character change this time around at overbought 70 RSI number trading sideways with prior 3 all quickly fading. Ignoring doji candle from last September adds to appeal.
- Earnings reactions mostly lower off 4.9, 2.2, and 1.4% on and before gain of .9% on 4/26/24.
- Enter after break above bull flag.
- Entry AEM here. Stop 95.50.
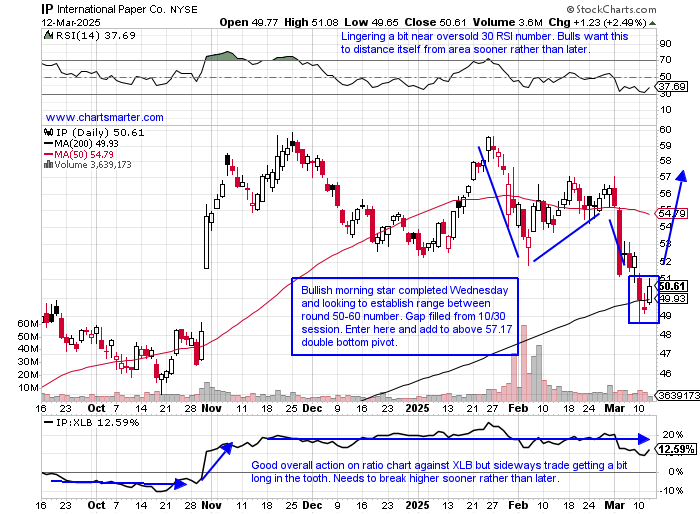
International Paper:
- Packaging play down 6% YTD and up 40% over last one year period. Dividend yield of 3.6%.
- Name 16% off most recent 52-week highs and WEEKLY chart shows nice action over last 10 months against XLB. Trading between leadership RSI parameters of 40/45-80/85 and this week so far bouncing off 50 WEEK SMA. Could be forming add-on double bottom pivot of 59.75.
- Earnings reactions mixed up 13.3 and .8% on 10/31 and 7/24/24 and fell 1.6 and 2.6% on 1/30 and 4/25/24.
- Enter on gap fill/bullish morning star.
- Entry IP here. Stop 48.25.
Good luck.
Entry summaries:
Buy after doji candle SCCO here. Stop 84.
Buy after break above bull flag AEM here. Stop 95.50.
Buy gap fill/bullish morning star IP here. Stop 48.25.
This article requires a Chartsmarter membership. Please click here to join.
Not Recessionary Behavior:
- Is copper strength signaling that a recession is not in the near-term future, or is it forecasting continued China firmness? That is a question for those who try and look smart. We are just trying to make money, and the daily chart below shows how leading instruments will offer add-on buy points on the way UP, contrary to popular opinion. As well, we know the best breakouts tend to work right away and that occurred with the move above 4.45 and now is sporting a bull flag formation. Notice the double bottom at 4 with a bullish hammer on 11/14, and the completion of a morning star on 1/3, and the golden cross from the beginning of March. The MONTHLY chart has a sanguine look with a bull flag that started at the COVID era lows right at the "round" $2. A CLOSE above a 4.75 pivot in March would be the first in the last decade and could carry a measured move to 6.50. There were 6 months that traded above 4.75 intramonth dating back to May 2021 but ZERO of them finished above 4.75 (March 2022 CLOSED right at 4.75).
Golden Roadblock?
- Doji candles are a rare occurrence and when they pop up one should take notice (we wrote about that candle here). It is not a panacea inside the technical analysis toolbox but it is a pretty reliable candle, especially when it occurs at an extreme area with PRICE near a potential exhaustion area on the up or downside. Often it will signal a possible trend change from the prevailing direction. With the MONTHLY chart of Gold below one can see the doji from last month right at the very round 3000 number. I think one can play this short with a tight stop above the figure, as we know vehicles that ignore these dubious candles should be considered very bullish. Gold has not recorded a 3-month losing streak since Q3 '23 but I think this could be purchased at a better basis and notice it is 900 handles above its 50 MONTH SMA. On the WEEKLY chart, the last week of October 2024 recorded a bearish gravestone doji as well and led to a 2500-point decline, and 2 weeks back it registered a bearish engulfing candle to put an end to an 8-week win streak. It is plausible we could see a move back to 2800, the top of that doji candle in October, before a nice push higher in the second half.
Recent Examples:
- The gold miners and the metal itself have been trading in tandem since last November, but that was not always the case as one can see how far apart they were last September and October as the miners were strongly outperforming. Now it is the opposite with the metal leading the way, if only fractionally here. The generals in the miner space are GFI and AGI. The former is now just above a 19.06 cup base pivot and is now dealing with the very round 20 number as it attempts to shed teenager status. Alamos Gold is trading well too and its WEEKLY chart shows it shrugging off back-to-back doji candles the weeks ending 2/21-28 as it charges higher looking to achieve a 12-week win streak this Friday, not a typo. Below is a leader to round out the trifecta with the daily chart of AEM and how it appeared in our 2/13 Materials Note. We will cover this name later in this note but it was a nice tactical trade and the fact that it is back at the very round par number so quickly after being rejected is bullish.
Special Situations:
Southern Copper:
- Copper UNCH YTD and up 7% over last one year period. Dividend yield of 2.2%.
- Name 29% off most recent 52-week highs and WEEKLY chart shows how for at least 2 years has been outshining rival FCX. Last week recorded bullish hammer candle that retested prior bull flag breakout from one year ago. Potential double bottom trigger of 118.38 setting up.
- FOUR staight positive earnings reactions up 1.4, 1.9, .3, and 2.4% on 1/30, 10/22, 7/19 and 4/25/24.
- Enter after doji candle.
- Entry SCCO here. Stop 84.
Agnico Mines:
- Canadian best-in-breed gold miner 29% YTD and 83% over last one year period. Dividend yield of 1.6%.
- Name 1% off most recent 52-week highs and MONTHLY chart shows trong action continuing after cup base breakout above 79.04 trigger. Notice character change this time around at overbought 70 RSI number trading sideways with prior 3 all quickly fading. Ignoring doji candle from last September adds to appeal.
- Earnings reactions mostly lower off 4.9, 2.2, and 1.4% on and before gain of .9% on 4/26/24.
- Enter after break above bull flag.
- Entry AEM here. Stop 95.50.
International Paper:
- Packaging play down 6% YTD and up 40% over last one year period. Dividend yield of 3.6%.
- Name 16% off most recent 52-week highs and WEEKLY chart shows nice action over last 10 months against XLB. Trading between leadership RSI parameters of 40/45-80/85 and this week so far bouncing off 50 WEEK SMA. Could be forming add-on double bottom pivot of 59.75.
- Earnings reactions mixed up 13.3 and .8% on 10/31 and 7/24/24 and fell 1.6 and 2.6% on 1/30 and 4/25/24.
- Enter on gap fill/bullish morning star.
- Entry IP here. Stop 48.25.
Good luck.
Entry summaries:
Buy after doji candle SCCO here. Stop 84.
Buy after break above bull flag AEM here. Stop 95.50.
Buy gap fill/bullish morning star IP here. Stop 48.25.