Sanguine Approach:
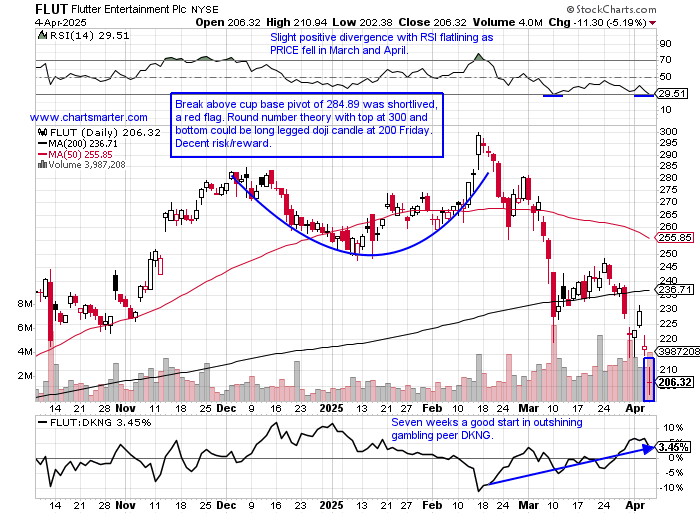
- It is extremely hard to determine if we are closer to the bottom or the top here, and trying to catch the precise low is a fool's game. In this environment, it is best to be tactical, keep losses very small, and have plenty of cash on hand. If one ones to take the path less traveled, and look for long opportunities next week demand names that have some technical merit. The discretionary space as a whole has been a disaster thus far in 2025 with the XLY down more than 18%, the tenth best of the 11 major S&P sectors. Of course, this is due to TSLA now off 51% from most recent 52-week highs and the WEEKLY chart shows it has advanced just 2 weeks this year, although the last 4 have recorded two bullish hammers and two inverted ones. AMZN is on a 9-week losing streak, its worst in at least 5 years dating back to an 8-week run the weeks ending between 4/1-5/20/22. Notice those were not the ultimate lows but it did push firmly off the very round par number, before the time frame between August 2022 and the rest of the year never recorded back-to-back WEEKLY gains. Looking under the hood however on Friday there were names displaying solid relative strength. Below is the daily chart of FLUT, a Druckenmiller play, and could be a good play after a doji candle Friday at the very round 200 number.
Trimming the Fat:
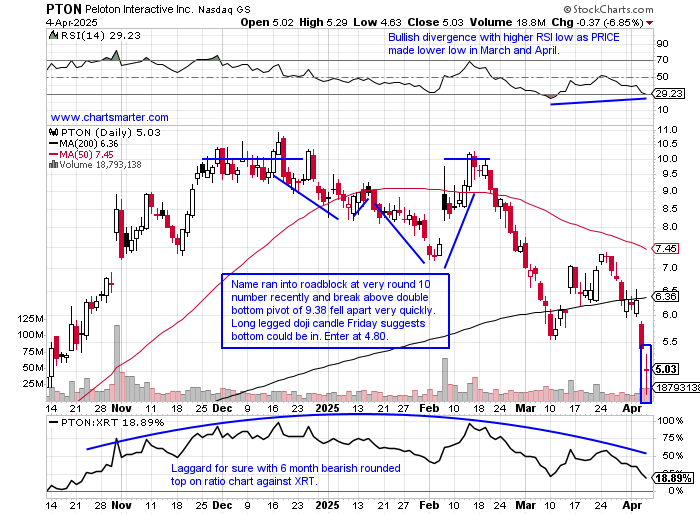
- As investor long-term portfolios have leaned out, to put it nicely last week, perhaps it is appropriate to look at a name that is proficient at shedding fat too. Readers of mine understand my dislike for single-digit names but the daily chart below of PTON is at an interesting inflection point. Of course, with any suggestions in my daily notes and with the current environment stay small until the smoke clears and wait for a bullish technical catalyst to appear. That possibly occurred Friday with the doji candle which is adept at signaling PRICE change from the prevailing direction. Candles have alerted market participants, none better than the gravestone doji in February on the MONTHLY chart after a furious run higher from a 2.70 low last April to a peak of almost 11 last December (notice the bearish evening star completed in February 2021 after the COVID peak). On the daily chart, a bearish evening star was completed on 12/18 and a doji on 2/18, both at the very round 10 number, which put a halt to its progress (the bullish island reversal finished with the gap up on 2/6 with the 12% earnings-related jump resulted in a quick pop). Keep the stop tight at 4.30 and treat this as pure speculation.
Recent Examples:
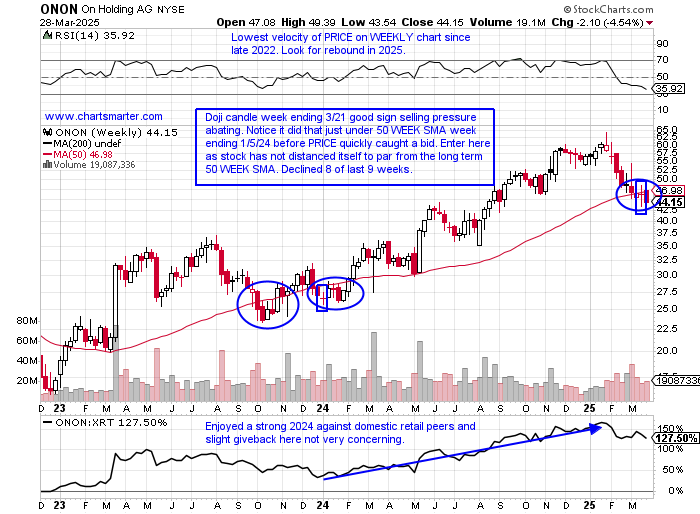
- As tariff talk dominates the investing landscape, some names behaved very well Friday on a dismal tape depending on their geography. A name we liked because of how European names in general were acting better overall against their domestic counterparts prior to late last week was ONON and how it appeared in our 3/31 Consumer Note. The WEEKLY doji candle appealed to us and we were WRONG and stopped out but could it be worth another look with a lot of the production emanating from Vietnam where negotiations were looked at in a positive light? On the updated daily chart one can see the bullish engulfing candle recorded Friday adding more than 5% (notice the near-term top was the doji recorded on 1/30). Developments could change very quickly so tread carefully, and any move underneath Friday's intraday low should have one exit. Look for an entry on a pullback at 38.
Special Situations:
Alibaba:
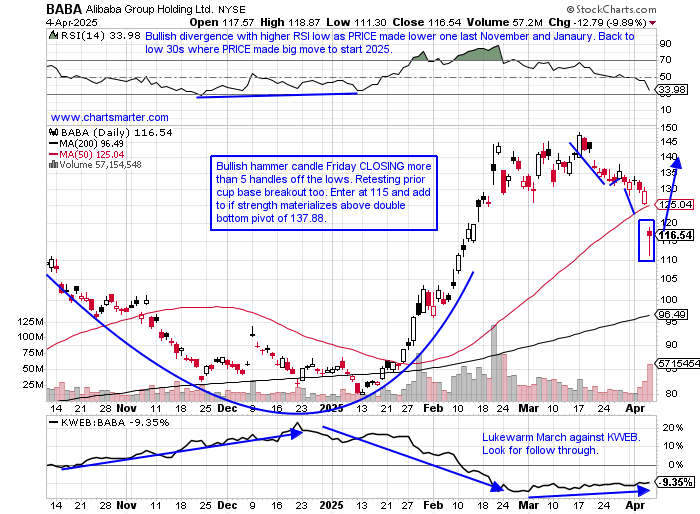
- Chinese internet retailer up 37% YTD and 63% over last one year period. Dividend yield of 1.7%.
- Name 21% off most recent 52 week highs and MONTHLY chart shows spinning top in March which can indicate fatigue. April very young and bulls do not want to see a bearish evening star complete. Must remain above 50 MONTH SMA. Has broken below uptrend on KWEB ratio chart.
- Earnings reactions up 8.1 and .1% on 2/20 and 8/15/24 and fell 2.2 and 6% on 11/15 and 2/7/24.
- Enter on pullback into bullish hammer candle.
- Entry BABA 115. Stop 111.
Deckers Outdoors:
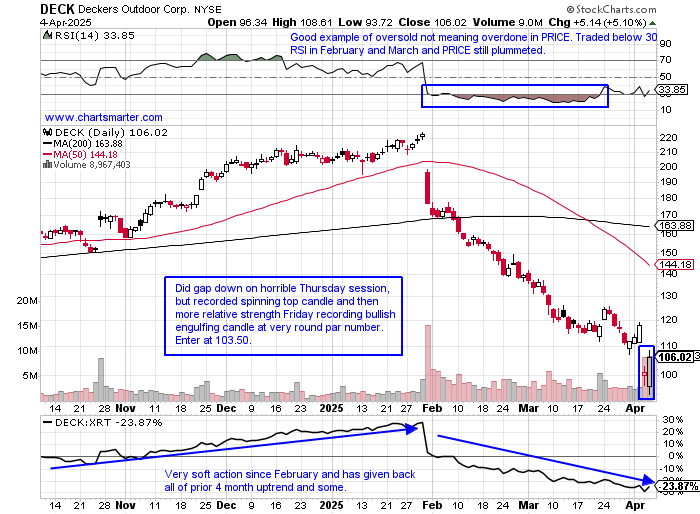
- Footwear play down 48% YTD and 28% over last one month period.
- Name 53% off most recent 52-week highs and MONTHLY chart which completed bearish three black crows pattern in March is now touching its 50 MONTH SMA which in years past has seen PRICE bounce. Must hold in this area. In 40/45 RSI area where leaders tend to floor.
- Earnings reactions mostly higher 10.6, 6.3, and 14.2% on 10/25, 7/26, and 5/24/24 before falling down 20.5% on 1/31.
- Enter on pullback into very round par number/bullish engulfing candle.
- Entry DECK 103.50. Stop 96.
Dutch Bros:
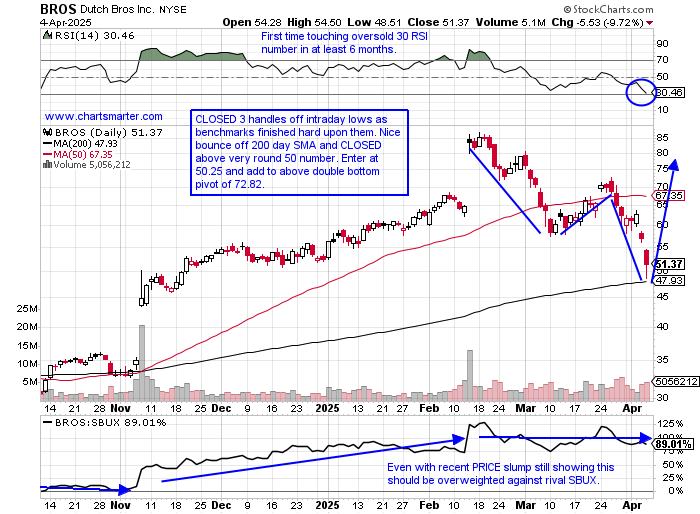
- Casual diner down 2% YTD and up 56% over last one year period.
- Name 41% off most recent 52-week highs and WEEKLY chart shows near touched rising 50 WEEK SMA for initial time following break above cup with handle from week ending 11/8 that rose 42%, often a good entry. Now in 45 RSI area a good spot previously for purchases.
- Earnings reactions mostly higher up 29.1, 28.1, and 11.8% on 2/13, 11/7, and 5/8/24 and fell 19.8% on 8/8/24.
- Enter on pullback into bounce off 200-day SMA.
- Entry BROS 49.75. Stop 46.
Good luck.
Entry summaries:
Buy pullback into bullish hammer candle BABA 115. Stop 111.
Buy pullback into very round par number/bullish engulfing candle DECK 103.50. Stop 96.
Buy pullback into bounce off 200-day SMA BROS 49.75. Stop 46.
This article requires a Chartsmarter membership. Please click here to join.
Sanguine Approach:
- It is extremely hard to determine if we are closer to the bottom or the top here, and trying to catch the precise low is a fool's game. In this environment, it is best to be tactical, keep losses very small, and have plenty of cash on hand. If one ones to take the path less traveled, and look for long opportunities next week demand names that have some technical merit. The discretionary space as a whole has been a disaster thus far in 2025 with the XLY down more than 18%, the tenth best of the 11 major S&P sectors. Of course, this is due to TSLA now off 51% from most recent 52-week highs and the WEEKLY chart shows it has advanced just 2 weeks this year, although the last 4 have recorded two bullish hammers and two inverted ones. AMZN is on a 9-week losing streak, its worst in at least 5 years dating back to an 8-week run the weeks ending between 4/1-5/20/22. Notice those were not the ultimate lows but it did push firmly off the very round par number, before the time frame between August 2022 and the rest of the year never recorded back-to-back WEEKLY gains. Looking under the hood however on Friday there were names displaying solid relative strength. Below is the daily chart of FLUT, a Druckenmiller play, and could be a good play after a doji candle Friday at the very round 200 number.

Trimming the Fat:
- As investor long-term portfolios have leaned out, to put it nicely last week, perhaps it is appropriate to look at a name that is proficient at shedding fat too. Readers of mine understand my dislike for single-digit names but the daily chart below of PTON is at an interesting inflection point. Of course, with any suggestions in my daily notes and with the current environment stay small until the smoke clears and wait for a bullish technical catalyst to appear. That possibly occurred Friday with the doji candle which is adept at signaling PRICE change from the prevailing direction. Candles have alerted market participants, none better than the gravestone doji in February on the MONTHLY chart after a furious run higher from a 2.70 low last April to a peak of almost 11 last December (notice the bearish evening star completed in February 2021 after the COVID peak). On the daily chart, a bearish evening star was completed on 12/18 and a doji on 2/18, both at the very round 10 number, which put a halt to its progress (the bullish island reversal finished with the gap up on 2/6 with the 12% earnings-related jump resulted in a quick pop). Keep the stop tight at 4.30 and treat this as pure speculation.

Recent Examples:
- As tariff talk dominates the investing landscape, some names behaved very well Friday on a dismal tape depending on their geography. A name we liked because of how European names in general were acting better overall against their domestic counterparts prior to late last week was ONON and how it appeared in our 3/31 Consumer Note. The WEEKLY doji candle appealed to us and we were WRONG and stopped out but could it be worth another look with a lot of the production emanating from Vietnam where negotiations were looked at in a positive light? On the updated daily chart one can see the bullish engulfing candle recorded Friday adding more than 5% (notice the near-term top was the doji recorded on 1/30). Developments could change very quickly so tread carefully, and any move underneath Friday's intraday low should have one exit. Look for an entry on a pullback at 38.

Special Situations:
Alibaba:
- Chinese internet retailer up 37% YTD and 63% over last one year period. Dividend yield of 1.7%.
- Name 21% off most recent 52 week highs and MONTHLY chart shows spinning top in March which can indicate fatigue. April very young and bulls do not want to see a bearish evening star complete. Must remain above 50 MONTH SMA. Has broken below uptrend on KWEB ratio chart.
- Earnings reactions up 8.1 and .1% on 2/20 and 8/15/24 and fell 2.2 and 6% on 11/15 and 2/7/24.
- Enter on pullback into bullish hammer candle.
- Entry BABA 115. Stop 111.

Deckers Outdoors:
- Footwear play down 48% YTD and 28% over last one month period.
- Name 53% off most recent 52-week highs and MONTHLY chart which completed bearish three black crows pattern in March is now touching its 50 MONTH SMA which in years past has seen PRICE bounce. Must hold in this area. In 40/45 RSI area where leaders tend to floor.
- Earnings reactions mostly higher 10.6, 6.3, and 14.2% on 10/25, 7/26, and 5/24/24 before falling down 20.5% on 1/31.
- Enter on pullback into very round par number/bullish engulfing candle.
- Entry DECK 103.50. Stop 96.

Dutch Bros:
- Casual diner down 2% YTD and up 56% over last one year period.
- Name 41% off most recent 52-week highs and WEEKLY chart shows near touched rising 50 WEEK SMA for initial time following break above cup with handle from week ending 11/8 that rose 42%, often a good entry. Now in 45 RSI area a good spot previously for purchases.
- Earnings reactions mostly higher up 29.1, 28.1, and 11.8% on 2/13, 11/7, and 5/8/24 and fell 19.8% on 8/8/24.
- Enter on pullback into bounce off 200-day SMA.
- Entry BROS 49.75. Stop 46.

Good luck.
Entry summaries:
Buy pullback into bullish hammer candle BABA 115. Stop 111.
Buy pullback into very round par number/bullish engulfing candle DECK 103.50. Stop 96.
Buy pullback into bounce off 200-day SMA BROS 49.75. Stop 46.