MONTHLY Greenshoots:
- As in life as in markets, the saying goes "It's not where you start but where you finish." If one was to look at the MONTHLY chart below of the Nasdaq there are some encouraging signs. It is making the positive habit of CLOSING near highs, a hallmark bullish trait, not only on the MONTHLY but the daily chart would show a combined 3% move on Thursday and Friday to conclude the week in above average volume. I was a bit skeptical that the MONTHLY chart was clinging too long to its 50-MONTH SMA, and I would still like to see it put some distance from that line. The bounce off the very round 10000 number that we spoke of in January continues and I was in the minority with my sanguine view in the last WEEK AHEAD note about the ongoing consolidation in April, but it looks like it may be ready to resolve to the upside. There is a potential bullish MONTHLY MACD crossover to monitor and for all the volatility April was the smallest range with 445 handles top to bottom in almost 4 years. That is a welcome sign. Of course, risks always remain and we are seeing concentrated gains in the mega caps, but respect the PRICE action until it is no longer warranted.

Getting Its Groove Back:
- There has been plenty of discussion about how international stocks have been besting domestic names here in the States but is that about to change? If the ratio chart comparing the VEU (All World Ex US ETF) to the S&P 500 has a say the answer would be a yes. The 50 WEEK SMA on the S&P 500 is starting to slope higher for the first time in one year, and the ratio chart looking at the VEU against the S&P 500 now shows three lower highs since mid-January. And that was after a sprint higher in favor of the VEU in Q4 22. The S&P 500 is still 4% off its most recent 52-week highs while the VEU is at its annual peak, but some things must be taken into account. The S&P 500 is doing this with US Sovereign Credit Default Swaps soaring. On the other side of the equation, recent data is saying large speculators are holding the largest net short S&P futures position in some time. The tug of war is real. But country ETFs like Mexico via the EWW are performing brilliantly. It broke above a bull flag just above the round 60 number and carries a measured move to 66. Poland, EPOL, is on the move with the best month of any international ETF rising 16%.
Tesla Turnaround?
- Over the last month's period, every one of the 11 major S&P sectors was in the green. With the exception of communication services, it was highlighted by very defensive groups excelling such as real estate, energy, and staples. But if we zoom out a bit on a YTD basis, technology and consumer discretionary are firmly entrenched at the top of the leaderboard. A big part of the XLY is the WEEKLY chart below of TSLA. Could it have out in a tradeable bottom with last week's dragonfly doji (remember the doji is adept at signaling potential PRICE direction changes)? On its daily chart, Thursday recorded a bullish piercing line candle that nearly filled in the gap from the 1/25 session. It could be starting a double bottom base above a 207.89 pivot, but it would be failure prone as it would be under the 200-day SMA. That would deliver a nice boost for the XLY as it looks to emerge from a symmetrical triangle. AMZN after-hours Thursday flirted with a huge move but reversed, but other top 5 holdings are pulling their weight. MCD has advanced 21 of the last 26 sessions, and 3 of those decliners were off less than .1% and is well above a cup base pivot near 280.
Delivery Bifurcation:
- The contrast in PRICE action became more highlighted this week with the breakdown in UPS following an ill-received earnings reaction on Tuesday losing 10% (it has now declined 4 of the last 5 times after REPORTING numbers). Curiously FDX on 3/17 jumped 8% and we can debate all day as to why (perhaps FDX has more international exposure as those markets continue to act better than our domestic ones) but PRICE action is irrefutable. On a YTD period, FDX is higher by 31% while UPS is up "just" 3%, a stark difference. This could also be partially responsible for the sideways trade in the XLI, where UPS is the third largest holding and more than double the weighting of FDX. The XLI CLOSED precisely at 100 Friday and that level has been an anchor with the vast majority of weeks since mid-November last year trading above and below par intraweek. A move through 102 could negate the dubious head and shoulders pattern and we know from FALSE moves come fast ones in the opposite direction.
Solar Stalling:
- And to be frank, using the word stalling is probably a bit generous. Is this soft action an indication that energy may be heading higher as the two are often compared? Over the last month's period, the XLE has risen 5% while the TAN is flat. The "coiling" action suggests a big move is imminent as higher lows and lower highs have been achieved on the WEEKLY chart dating back to last November. This symmetrical triangle formed after a steep downtrend, losing 40% during an 11 of 13-week losing streak the weeks ending between 11/5/21-1/28/22, making the likely next move lower. If 70 is taken out to the downside the measured move would be to 25. Friday that number was touched and produced a bullish hammer candle so it may give some temporary relief for the bulls. Concerns include a downward-sloping 50-day SMA since January, and remember this group is classified as technology, and with the Nasdaq soaring more than 10% that month perhaps it was the canary in the coal mine. Add to that the negative nature of its trade, very wide and loose, and an ugly gap down on Wednesday. This makes for a cloudy outlook, pun intended. Lets take a look at 2 names below.
First Solar:
- Solar play is up 22% YTD and 153% over last one year period.
- Name 18% off most recent 52-week highs and lost 16% last week, its first double-digit WEEKLY loss since week ending 5/13/22. Occurred not long after 16-week losing streak, not a typo, weeks ending between 11/5/21-2/18/22.
- Earnings reactions mostly higher up 15.7, 1.1 and 12.1% on 3/1, 10/28, and 7/29/22 before recent loss of 9.1% on 4/28
- Enter on pullback into bullish hammer candle.
- Entry FSLR 177. Stop 165.
Array Technologies:
- Solar play up 6% YTD and 200% over last one year period.
- Name 17% off most recent 52-week highs and could make for bullish WEEKLY ascending triangle that began with a 5-handle one year ago. A break above 24.50 would carry a measured move to 45.
- Three straight positive earnings reactions up 4.8, 13.5, and 28.9% on 3/21, 11/9, and 8/10/22 after a loss of 7.2% on 5/11/22.
- Enter after 200-day SMA bounce/bullish hammer at very round figure.
- Entry ARRY here. Stop 19.
Good luck.
This article requires a Chartsmarter membership. Please click here to join.
MONTHLY Greenshoots:
- As in life as in markets, the saying goes "It's not where you start but where you finish." If one was to look at the MONTHLY chart below of the Nasdaq there are some encouraging signs. It is making the positive habit of CLOSING near highs, a hallmark bullish trait, not only on the MONTHLY but the daily chart would show a combined 3% move on Thursday and Friday to conclude the week in above average volume. I was a bit skeptical that the MONTHLY chart was clinging too long to its 50-MONTH SMA, and I would still like to see it put some distance from that line. The bounce off the very round 10000 number that we spoke of in January continues and I was in the minority with my sanguine view in the last WEEK AHEAD note about the ongoing consolidation in April, but it looks like it may be ready to resolve to the upside. There is a potential bullish MONTHLY MACD crossover to monitor and for all the volatility April was the smallest range with 445 handles top to bottom in almost 4 years. That is a welcome sign. Of course, risks always remain and we are seeing concentrated gains in the mega caps, but respect the PRICE action until it is no longer warranted.
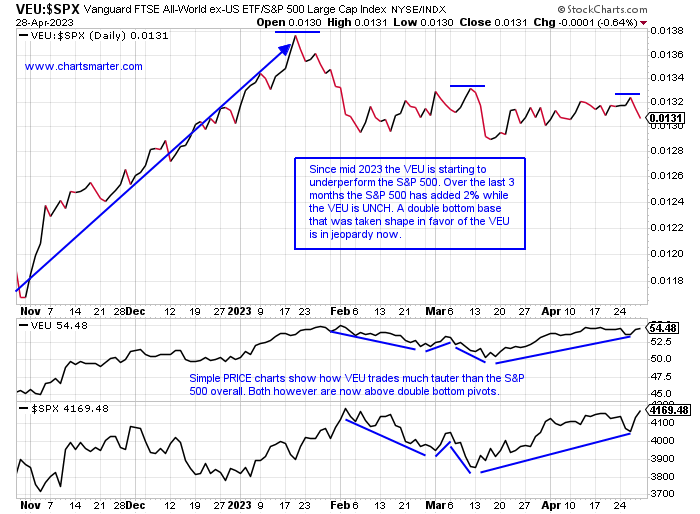
Getting Its Groove Back:
- There has been plenty of discussion about how international stocks have been besting domestic names here in the States but is that about to change? If the ratio chart comparing the VEU (All World Ex US ETF) to the S&P 500 has a say the answer would be a yes. The 50 WEEK SMA on the S&P 500 is starting to slope higher for the first time in one year, and the ratio chart looking at the VEU against the S&P 500 now shows three lower highs since mid-January. And that was after a sprint higher in favor of the VEU in Q4 22. The S&P 500 is still 4% off its most recent 52-week highs while the VEU is at its annual peak, but some things must be taken into account. The S&P 500 is doing this with US Sovereign Credit Default Swaps soaring. On the other side of the equation, recent data is saying large speculators are holding the largest net short S&P futures position in some time. The tug of war is real. But country ETFs like Mexico via the EWW are performing brilliantly. It broke above a bull flag just above the round 60 number and carries a measured move to 66. Poland, EPOL, is on the move with the best month of any international ETF rising 16%.
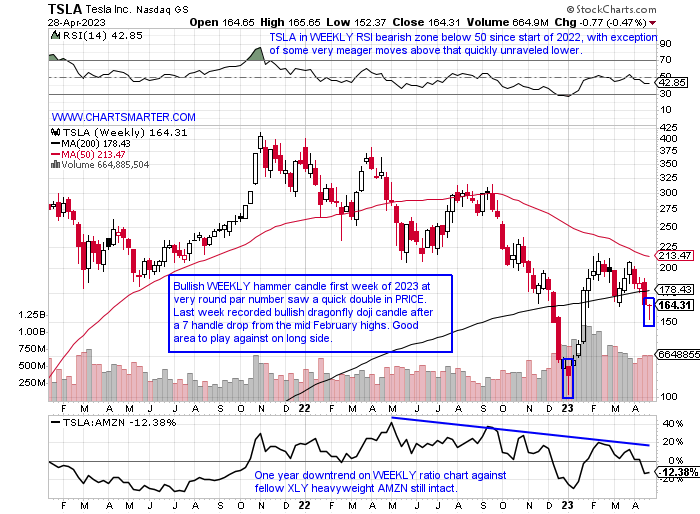
Tesla Turnaround?
- Over the last month's period, every one of the 11 major S&P sectors was in the green. With the exception of communication services, it was highlighted by very defensive groups excelling such as real estate, energy, and staples. But if we zoom out a bit on a YTD basis, technology and consumer discretionary are firmly entrenched at the top of the leaderboard. A big part of the XLY is the WEEKLY chart below of TSLA. Could it have out in a tradeable bottom with last week's dragonfly doji (remember the doji is adept at signaling potential PRICE direction changes)? On its daily chart, Thursday recorded a bullish piercing line candle that nearly filled in the gap from the 1/25 session. It could be starting a double bottom base above a 207.89 pivot, but it would be failure prone as it would be under the 200-day SMA. That would deliver a nice boost for the XLY as it looks to emerge from a symmetrical triangle. AMZN after-hours Thursday flirted with a huge move but reversed, but other top 5 holdings are pulling their weight. MCD has advanced 21 of the last 26 sessions, and 3 of those decliners were off less than .1% and is well above a cup base pivot near 280.
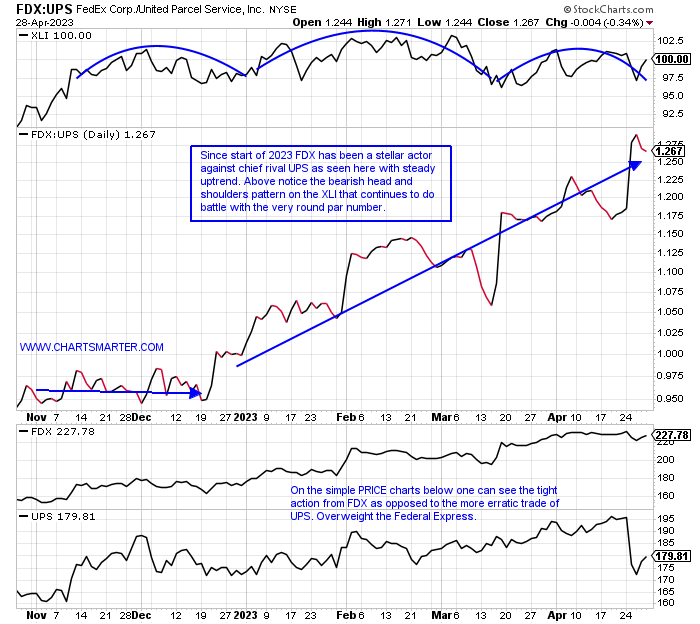
Delivery Bifurcation:
- The contrast in PRICE action became more highlighted this week with the breakdown in UPS following an ill-received earnings reaction on Tuesday losing 10% (it has now declined 4 of the last 5 times after REPORTING numbers). Curiously FDX on 3/17 jumped 8% and we can debate all day as to why (perhaps FDX has more international exposure as those markets continue to act better than our domestic ones) but PRICE action is irrefutable. On a YTD period, FDX is higher by 31% while UPS is up "just" 3%, a stark difference. This could also be partially responsible for the sideways trade in the XLI, where UPS is the third largest holding and more than double the weighting of FDX. The XLI CLOSED precisely at 100 Friday and that level has been an anchor with the vast majority of weeks since mid-November last year trading above and below par intraweek. A move through 102 could negate the dubious head and shoulders pattern and we know from FALSE moves come fast ones in the opposite direction.
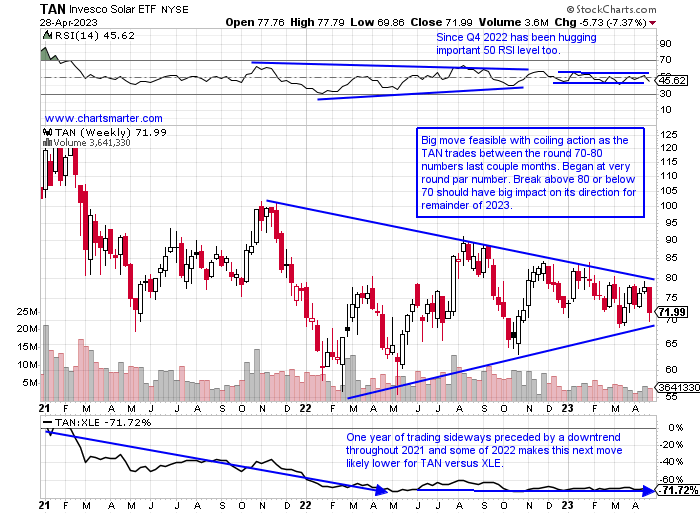
Solar Stalling:
- And to be frank, using the word stalling is probably a bit generous. Is this soft action an indication that energy may be heading higher as the two are often compared? Over the last month's period, the XLE has risen 5% while the TAN is flat. The "coiling" action suggests a big move is imminent as higher lows and lower highs have been achieved on the WEEKLY chart dating back to last November. This symmetrical triangle formed after a steep downtrend, losing 40% during an 11 of 13-week losing streak the weeks ending between 11/5/21-1/28/22, making the likely next move lower. If 70 is taken out to the downside the measured move would be to 25. Friday that number was touched and produced a bullish hammer candle so it may give some temporary relief for the bulls. Concerns include a downward-sloping 50-day SMA since January, and remember this group is classified as technology, and with the Nasdaq soaring more than 10% that month perhaps it was the canary in the coal mine. Add to that the negative nature of its trade, very wide and loose, and an ugly gap down on Wednesday. This makes for a cloudy outlook, pun intended. Lets take a look at 2 names below.
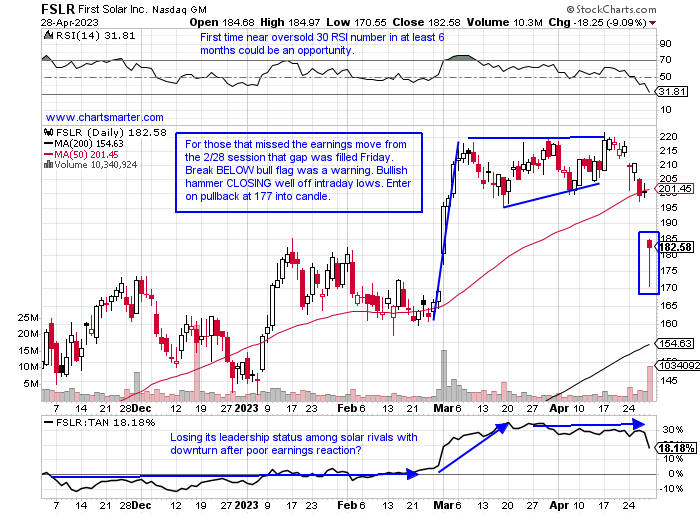
First Solar:
- Solar play is up 22% YTD and 153% over last one year period.
- Name 18% off most recent 52-week highs and lost 16% last week, its first double-digit WEEKLY loss since week ending 5/13/22. Occurred not long after 16-week losing streak, not a typo, weeks ending between 11/5/21-2/18/22.
- Earnings reactions mostly higher up 15.7, 1.1 and 12.1% on 3/1, 10/28, and 7/29/22 before recent loss of 9.1% on 4/28
- Enter on pullback into bullish hammer candle.
- Entry FSLR 177. Stop 165.
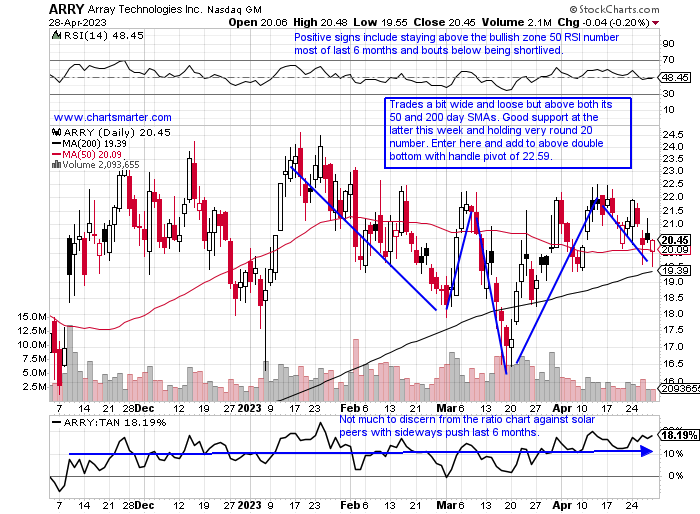
Array Technologies:
- Solar play up 6% YTD and 200% over last one year period.
- Name 17% off most recent 52-week highs and could make for bullish WEEKLY ascending triangle that began with a 5-handle one year ago. A break above 24.50 would carry a measured move to 45.
- Three straight positive earnings reactions up 4.8, 13.5, and 28.9% on 3/21, 11/9, and 8/10/22 after a loss of 7.2% on 5/11/22.
- Enter after 200-day SMA bounce/bullish hammer at very round figure.
- Entry ARRY here. Stop 19.
Good luck.