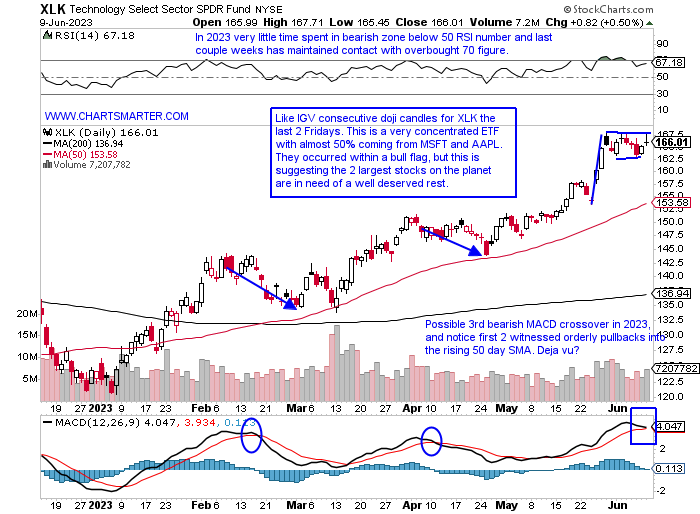
Technology Spent?
- If candlesticks could talk to us the doji is the one with the loudest voice. Keep in mind PRICE is omnipotent and in powerful bull markets, bearish candlesticks get run over as instruments continue their ascent. But when they start to happen in such quick succession after a powerful run it is time to take notice. I am nowhere near saying a bear market or crash is to occur, but remember as market participants our number one job is to protect our capital. A healthy pause in a bull market, giving major moving averages a chance to comfort the indexes or individual names is a positive development. Last weekend's WEEK AHEAD Note we looked at software, via the IGV, recording the doji candle on 6/2, and on 6/9 it made it back-to-back Fridays registering the dubious candle. They are adept at signaling fatigue or even changes in the prevailing direction. I think this is a case of the former, but looking at overall technology with the chart below of the XLK one has to wonder if the group has gotten ahead of itself just a little bit. The XLK was one of just 2 of the major 11 S&P sectors to decline last week, albeit just fractionally by .5%.
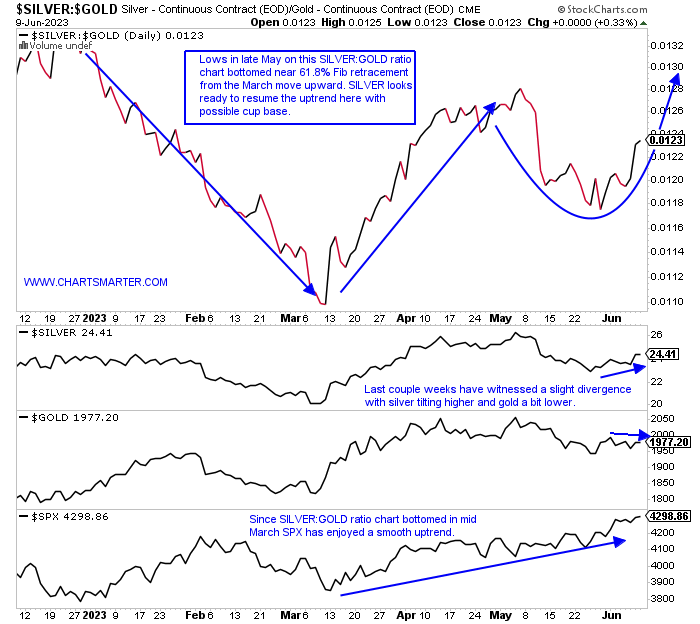
Silver Lining:
- As gold is thought of as a safe haven, when its ratio chart against silver is in favor of the latter it is often a good sign for markets. Silver is valuable in a variety of economic functions, including its use in semiconductors, but just looking at PRICE can give us a good indication of a sanguine market outlook. Notice at the bottom of the chart below how the S&P 500 put a soft February behind it once silver started to outshine gold, pun intended. As the GOLD 50-day SMA begins to flatline and it remains below the very round 2000 number, it is shaping up a bear flag formation. SILVER on the other hand has a 50-day that is still sloping higher, although it was stopped cold on Friday. SILVER did bottom in March with back-to-back spinning top candles at the very round 20 number on 3/8-9 and ran higher by more than 30% over the next couple of months before some recent digestion of that move. In the last couple of weeks, the SLV rose by 1.4 and 2.7% as the GLD was essentially UNCH.
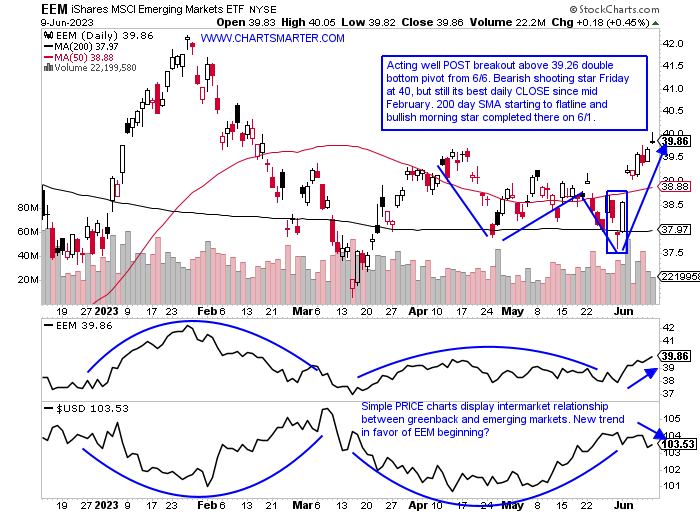
Dollar Implications:
- As the greenback has now almost met our target near 105, will its potential weakness but a tailwind for emerging markets? The chart below of the EEM suggests so. It has advanced 9 of the last 12 weeks and on its WEEKLY chart, the long downtrend between February '21-October '22 seems firmly in the rearview mirror and currently has the look of building the right side of a cup base. The daily chart here shows 3 successful retests of the 200-day SMA, with the last one a bullish morning star pattern on 6/1 which could also be interpreted as a bullish island reversal with the gap higher (after the gap lower on 5/24) the very next session on double average daily volume. Of course, a lot of this will depend on China which represents a majority of the top holdings in the ETF. There is some Brazil representation within and the EWZ has continued its nice run following the cup with handle breakout above a 30.54 pivot on 6/2. The last couple weeks jumped 5.5% as it broke away from a 3-week tight pattern with the 3 weeks ending between 5/12-26 all CLOSING within just .14 of each other.
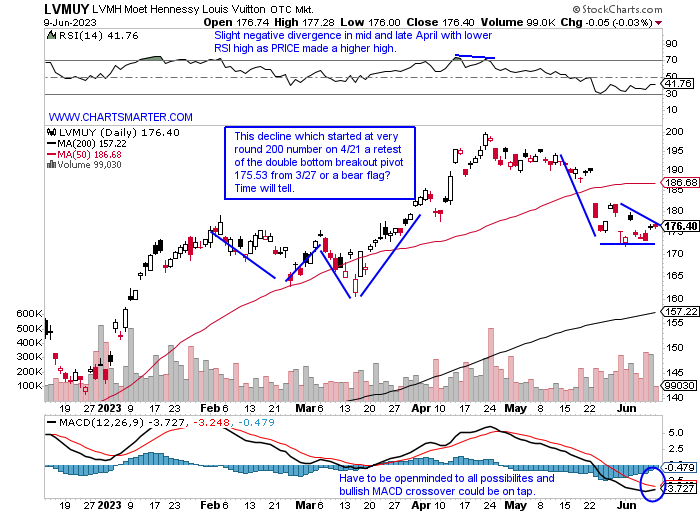
Luxury Leader Trouble?
- European luxury names once seemed like Teflon to the weakness that was somewhat pervasive if compared to say the XRT earlier in 2023. BURBY which ended a 6-week losing streak with last week's bullish engulfing candle trades 15% off its most recent 52-week highs. ZGN is the same amount off its own annual peak which came in February, not long after it failed to break above a 13.88 double bottom trigger. SWGAY is on a 6-week losing streak and is now 21% off its peak in March which was a 2-year double top pattern on its WEEKLY chart near 18. Perhaps the most visible from the prior very strong European region has been the softness in the chart below of LVMUY. It is a relatively mild 12% off its highs made at the very round 200 number (with last week's TSLA surge Musk has overtaken Arnault as the world's richest man) and on its first 5-week losing streak in 2 years (prior to that had not recorded a 4-week losing streak). This name was almost solely responsible last November for the CAC overtaking the FTSE as Europe's most valuable stock market at the time. Its chart is at an inflection point right here.
Will Smaller Cap Consumer Names Catch Up?
- Over the last one-week and one-month period automobiles have been the largest contributor to the consumer discretionary space via the XLY. While many look rightfully so to TSLA, F looks like it wants to spring to life. Ford jumped 11% this week to record its first 3-week win streak of 2023, although big WEEKLY advances this year have done little to move the stock (the week ending 3/3 rose 10% then the next 2 fell by a combined 14%, and week ending 3/31 rose 9.5% only to give it all back over the next 8 weeks). But getting back to the point after that ramble with the ratio chart below comparing larger consumer discretionary names to "smaller" ones still shows an affinity for the former. But will smaller names play catch up? I think they will as one peeks at the lower part of the chart showing a nice break-in stocks in the group climbing above their 50-day SMAs. That speaks to more participation. Nevertheless let's take a look at a couple of good-looking opportunities in the overall discretionary space in NKE and ONON.
Nike:
- Footwear giant lower by 10% YTD and 11% over last one year period. Dividend yield of 1.3%.
- Name 20% off most recent 52-week highs and footwear laggard in strong group with SKX stalking a long WEEKLY cup with handle pivot of 54.87, although DECK having issues with very round 500 number with possible double top.
- Earnings reactions mostly lower, off 4.9, 12.8, and 7% on 3/22, 9/30, and 6/28/22, and rose 12.2% on 12/21/22.
- Enter after recent gap fill just above very round par number.
- Entry NKE here. Stop 102.
On Holding AG:
- Swiss footwear play up 79% YTD and 48% over last one year period.
- Name 12% off most recent 52-week highs and solid relative strength this week up 10%, and now cutting into the big week ending 5/19 loss of 19% in huge trade. WEEKLY cup with handle pattern taking shape with 34.98 add-on pivot in base dating back to when company came public.
- Earnings reactions mostly lower, off 9.7, 8.7, and .7% on 5/16, 11/16, and 8/16/22, and rose 26.4% on 3/21.
- Enter on pullback into break above WEEKLY bullish inverse head and shoulders pattern.
- Entry ONON 29. Stop 27.
Good luck.
This article requires a Chartsmarter membership. Please click here to join.
Technology Spent?
- If candlesticks could talk to us the doji is the one with the loudest voice. Keep in mind PRICE is omnipotent and in powerful bull markets, bearish candlesticks get run over as instruments continue their ascent. But when they start to happen in such quick succession after a powerful run it is time to take notice. I am nowhere near saying a bear market or crash is to occur, but remember as market participants our number one job is to protect our capital. A healthy pause in a bull market, giving major moving averages a chance to comfort the indexes or individual names is a positive development. Last weekend's WEEK AHEAD Note we looked at software, via the IGV, recording the doji candle on 6/2, and on 6/9 it made it back-to-back Fridays registering the dubious candle. They are adept at signaling fatigue or even changes in the prevailing direction. I think this is a case of the former, but looking at overall technology with the chart below of the XLK one has to wonder if the group has gotten ahead of itself just a little bit. The XLK was one of just 2 of the major 11 S&P sectors to decline last week, albeit just fractionally by .5%.
Silver Lining:
- As gold is thought of as a safe haven, when its ratio chart against silver is in favor of the latter it is often a good sign for markets. Silver is valuable in a variety of economic functions, including its use in semiconductors, but just looking at PRICE can give us a good indication of a sanguine market outlook. Notice at the bottom of the chart below how the S&P 500 put a soft February behind it once silver started to outshine gold, pun intended. As the GOLD 50-day SMA begins to flatline and it remains below the very round 2000 number, it is shaping up a bear flag formation. SILVER on the other hand has a 50-day that is still sloping higher, although it was stopped cold on Friday. SILVER did bottom in March with back-to-back spinning top candles at the very round 20 number on 3/8-9 and ran higher by more than 30% over the next couple of months before some recent digestion of that move. In the last couple of weeks, the SLV rose by 1.4 and 2.7% as the GLD was essentially UNCH.
Dollar Implications:
- As the greenback has now almost met our target near 105, will its potential weakness but a tailwind for emerging markets? The chart below of the EEM suggests so. It has advanced 9 of the last 12 weeks and on its WEEKLY chart, the long downtrend between February '21-October '22 seems firmly in the rearview mirror and currently has the look of building the right side of a cup base. The daily chart here shows 3 successful retests of the 200-day SMA, with the last one a bullish morning star pattern on 6/1 which could also be interpreted as a bullish island reversal with the gap higher (after the gap lower on 5/24) the very next session on double average daily volume. Of course, a lot of this will depend on China which represents a majority of the top holdings in the ETF. There is some Brazil representation within and the EWZ has continued its nice run following the cup with handle breakout above a 30.54 pivot on 6/2. The last couple weeks jumped 5.5% as it broke away from a 3-week tight pattern with the 3 weeks ending between 5/12-26 all CLOSING within just .14 of each other.
Luxury Leader Trouble?
- European luxury names once seemed like Teflon to the weakness that was somewhat pervasive if compared to say the XRT earlier in 2023. BURBY which ended a 6-week losing streak with last week's bullish engulfing candle trades 15% off its most recent 52-week highs. ZGN is the same amount off its own annual peak which came in February, not long after it failed to break above a 13.88 double bottom trigger. SWGAY is on a 6-week losing streak and is now 21% off its peak in March which was a 2-year double top pattern on its WEEKLY chart near 18. Perhaps the most visible from the prior very strong European region has been the softness in the chart below of LVMUY. It is a relatively mild 12% off its highs made at the very round 200 number (with last week's TSLA surge Musk has overtaken Arnault as the world's richest man) and on its first 5-week losing streak in 2 years (prior to that had not recorded a 4-week losing streak). This name was almost solely responsible last November for the CAC overtaking the FTSE as Europe's most valuable stock market at the time. Its chart is at an inflection point right here.
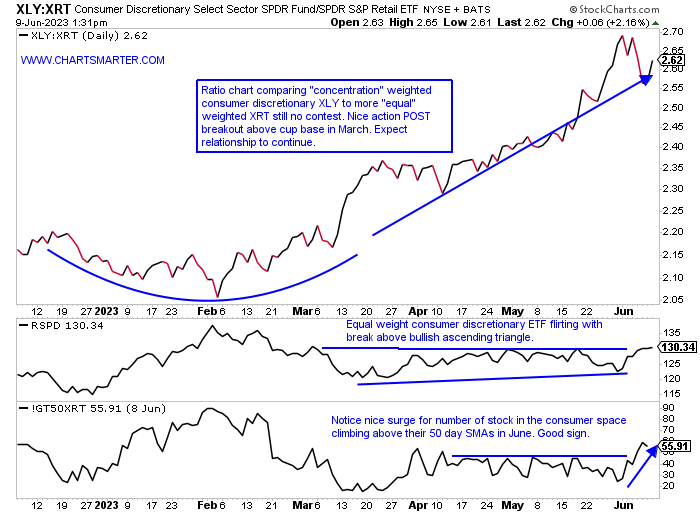
Will Smaller Cap Consumer Names Catch Up?
- Over the last one-week and one-month period automobiles have been the largest contributor to the consumer discretionary space via the XLY. While many look rightfully so to TSLA, F looks like it wants to spring to life. Ford jumped 11% this week to record its first 3-week win streak of 2023, although big WEEKLY advances this year have done little to move the stock (the week ending 3/3 rose 10% then the next 2 fell by a combined 14%, and week ending 3/31 rose 9.5% only to give it all back over the next 8 weeks). But getting back to the point after that ramble with the ratio chart below comparing larger consumer discretionary names to "smaller" ones still shows an affinity for the former. But will smaller names play catch up? I think they will as one peeks at the lower part of the chart showing a nice break-in stocks in the group climbing above their 50-day SMAs. That speaks to more participation. Nevertheless let's take a look at a couple of good-looking opportunities in the overall discretionary space in NKE and ONON.
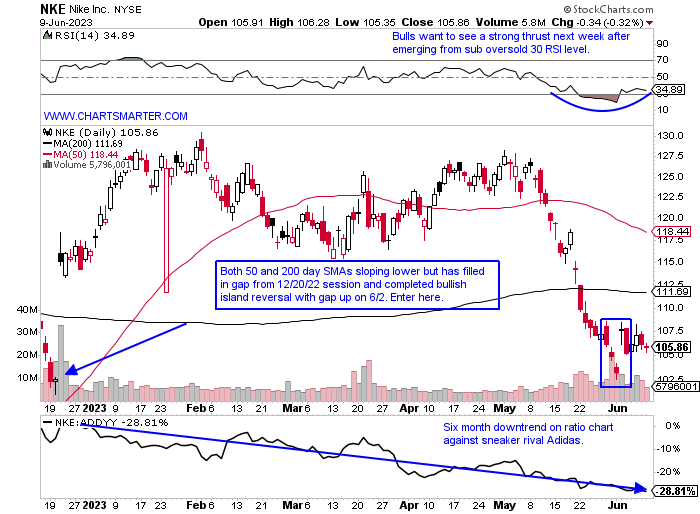
Nike:
- Footwear giant lower by 10% YTD and 11% over last one year period. Dividend yield of 1.3%.
- Name 20% off most recent 52-week highs and footwear laggard in strong group with SKX stalking a long WEEKLY cup with handle pivot of 54.87, although DECK having issues with very round 500 number with possible double top.
- Earnings reactions mostly lower, off 4.9, 12.8, and 7% on 3/22, 9/30, and 6/28/22, and rose 12.2% on 12/21/22.
- Enter after recent gap fill just above very round par number.
- Entry NKE here. Stop 102.
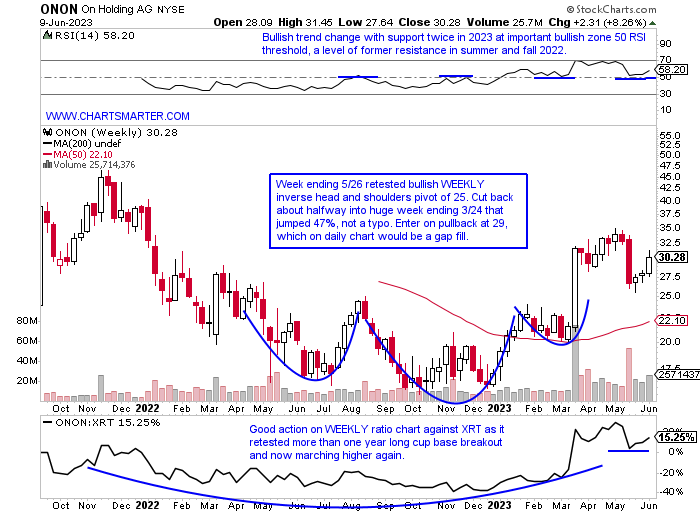
On Holding AG:
- Swiss footwear play up 79% YTD and 48% over last one year period.
- Name 12% off most recent 52-week highs and solid relative strength this week up 10%, and now cutting into the big week ending 5/19 loss of 19% in huge trade. WEEKLY cup with handle pattern taking shape with 34.98 add-on pivot in base dating back to when company came public.
- Earnings reactions mostly lower, off 9.7, 8.7, and .7% on 5/16, 11/16, and 8/16/22, and rose 26.4% on 3/21.
- Enter on pullback into break above WEEKLY bullish inverse head and shoulders pattern.
- Entry ONON 29. Stop 27.
Good luck.