"The stuff you own ends up owning you." Brad Pitt
Advisors Exposed?
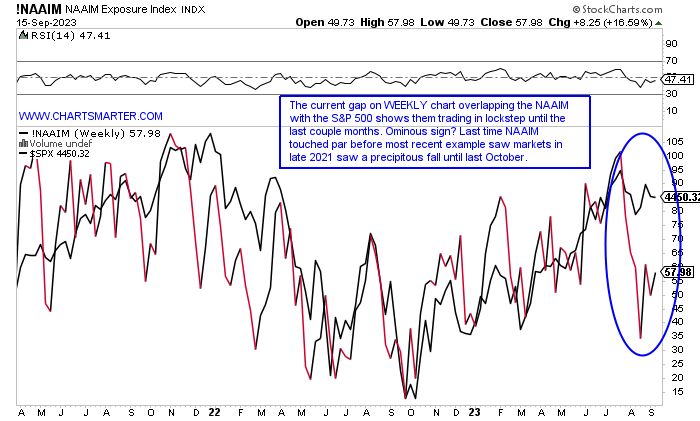
- When prior correlations break down could that be a sign of a major market event? Of course, no one can predict that but the chart below looking at the NAAIM Exposure Index to the S&P 500 shows a glaring disparity. As the NAAIM fell out of bed recently, the S&P 500 maintained its lofty altitude. Is that a sign that the S&P 500 is about to undergo a sizable correction? The last time that NAAIM reached the very round par number in late 2021 we all know what happened to the S&P 500. From the end of 2021 to October 2022 the widely followed benchmark traded from 4800 to 3500. I am not saying this will occur again but it does give another notch in the belt of bears. For those blaming triple witching on the big index declines Friday, the last two examples on 8/18 and 7/21 were precisely UNCH and just one since April fell more than .4%. I still think we are in wait-and-see mode, and no need to take large positions here until a clear direction is seen with markets. After all the S&P 500 has traded the last 2 weeks inside the strong week ending 9/1 that rose 2.5%.
Warning Signs?
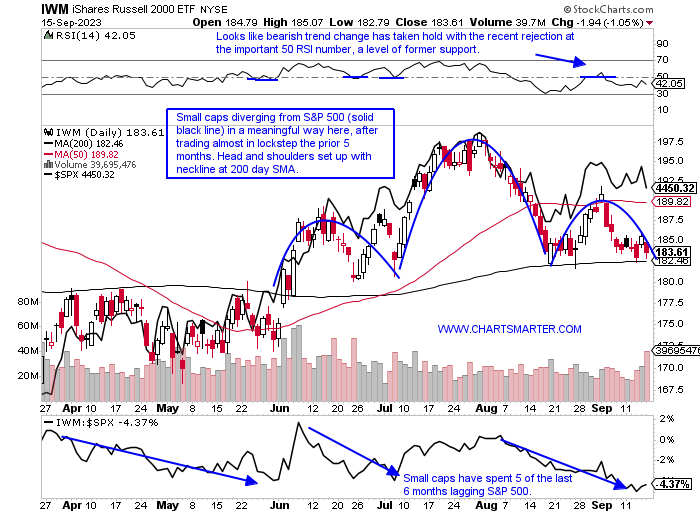
- We all know small caps are often good leading indicators, and if that is the case the chart below showing how the IWM and S&P 500 have been traveling down different paths could be worrisome. It could be as simple as the small caps being held hostage by rising interest rates or something more sinister. Over the last one month period as the S&P 500 is UNCH the IWM has declined more than 2%. Will the S&P 500 play catch "down" to the IWM? Of course, no one knows but if the IWM breaks below the bearish head and shoulders pivot of 182, which doubles as 200-day SMA support, there is a good chance it may. Is it too obvious? Perhaps, but that 200 day which acted as resistance in April and May has been support several times since the powerful break above the secular line on 6/2 jumping almost 4%. That has been the strongest gain in 2023 thus far, and if that area should hold the seasonality factors for small caps become very favorable with average gains of better than 5% in October and November, not a typo over the last 4 years. Additionally, it has already lost more this September than its normal 3% already.
Market Implications:
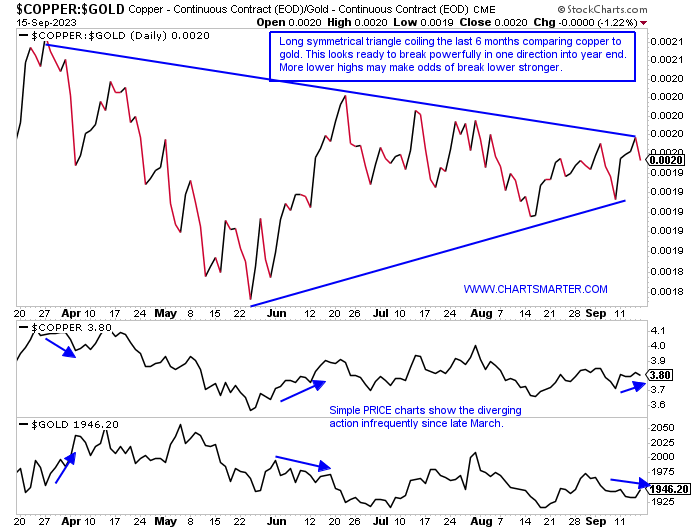
- Looking below the ratio chart of Copper against Gold shows a narrowing range since basically the end of Q1. Market participants like to evaluate this to give an overview of what they think could happen to the benchmarks. Traditionally it is thought of as if Copper is outperforming gold it is a positive sign for the major averages, and vice versa as it would be a defensive look if gold was shining brightly against the Doctor. When tradable instruments start to coil like the one below it is often a harbinger of a very robust move. In the symmetrical triangle, this can break in either direction so watching to see which way this breaks could have a large significance to how this market trades in Q4. Looking at individual copper names SCCO is still my favorite over FCX, as it is just 9% off most recent 52-week highs (FCX is 14% off its own), it is up 32% YTD compared to FCX by just 6% and lastly yields 5% while FCX is .7%. Most importantly the technical look is superior as it sports a good-looking WEEKLY bull flag.
Nuclear Necessities:
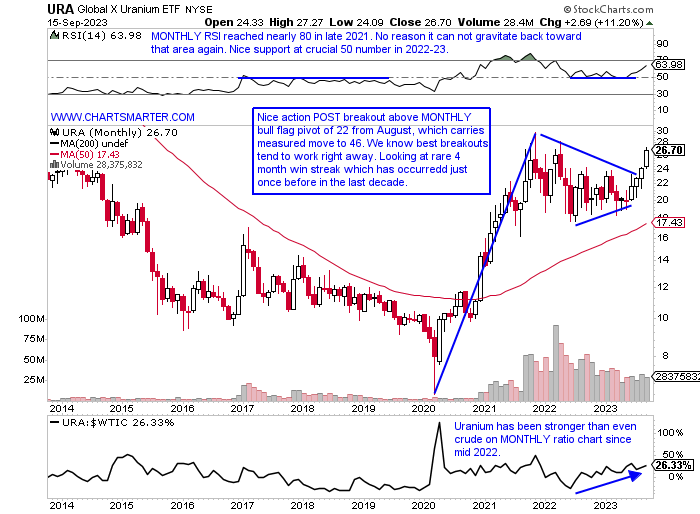
- As nuclear power is more and more being embraced with the transition to clean energy, it is confirmed by the PRICE action in many of the instruments that trade. Below is the MONTHLY chart of the URA which displayed excellent follow-through above the bull flag pivot of 22 in August (a measured move to 46 could potentially take a couple of years). So far in September, the volume is about the MONTHLY average with 2 weeks still yet to go. The top holding in the ETF in CCJ (full disclosure I have been long for 6 months) is behaving powerfully although it did record a bearish shooting star candle Friday. But in bull markets, those often are overlooked as the stock powers on. Options activity in the name has also been bullish. Another name in the nuclear space that warrants attention is the utility play in CEG. It has been trending higher in a very smooth fashion, although it did register a bearish engulfing candle. CCJ and CEG have advanced 78 and 27% YTD respectively so far and any pullbacks in the 5-6% range going forward into year-end should be viewed as long opportunities.
"Cracking" Out:
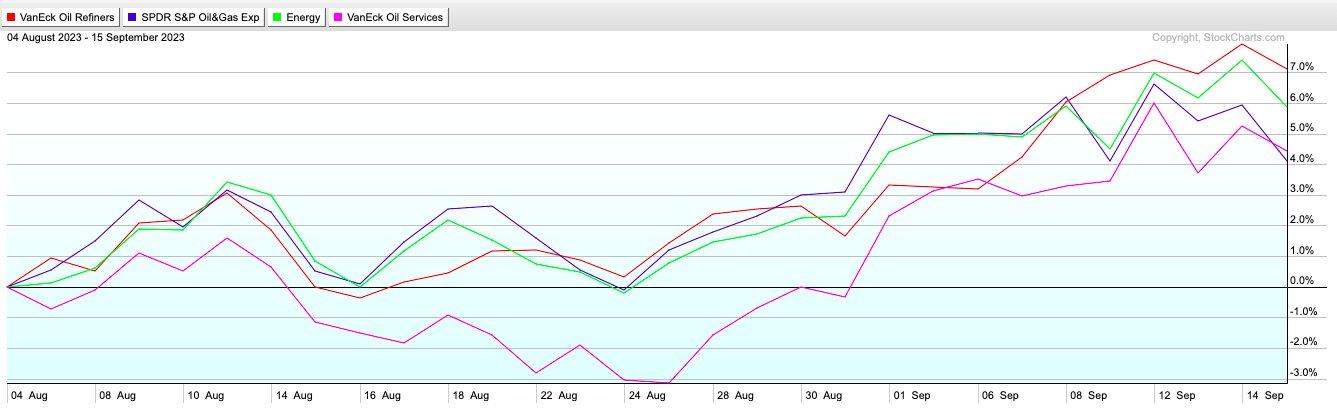
- The refiners have been the best-acting subgroup inside the leading energy sector as seen on the chart below over the last 30 days. The CRAK ETF, which is an illiquid vehicle, is now just 1% off most recent 52-week highs and one can use it simply as a good illustration of how names within are behaving against the drillers and producers. CRAK is higher 11 of the last 12 weeks, and caution may be warranted as last week did break above a WEEKLY bullish ascending triangle, but recorded a doji candle, which is adept at signaling a possible change in the prevailing direction. Notice the weeks ending 6/10/22 and 1/17/23 did register bearish WEEKLY shooting stars. Other groups like the XOP have broken above a bull flag, but have since recorded dubious candlesticks and we know the best breakouts tend to work right away, so perhaps the energy space as a whole needs some time to digest some of their robust advances. That being said each individual stock should be looked at with its own merit and below we take a peek at DK and DINO.
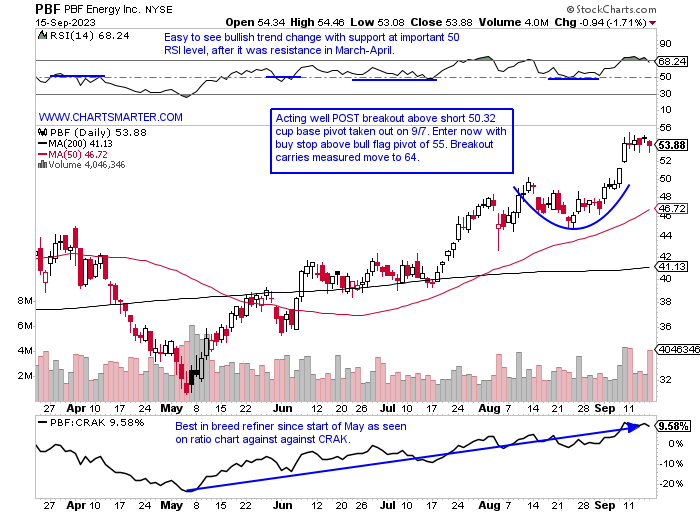
PBF Energy:
- Refiner play up 32% YTD and 87% over last one year period. Dividend yield of 1.5%.
- Name 3% off most recent 52-week highs and excellent relative strength the week ending 9/8 that jumped more than 10% as the CRAK rose 2.6%. And PBF was basically UNCH last week absorbing those lofty gains. Five of the last 6 weeks CLOSED at highs for WEEKLY range.
- Earnings reactions mostly higher up 1.9, 7.5, and 3.5% on 5/5, 2/16, and 10/27/22 before a recent loss of 4.2% on 8/3.
- Enter with buy stop above bull flag.
- Entry PBF 55. Stop 53.
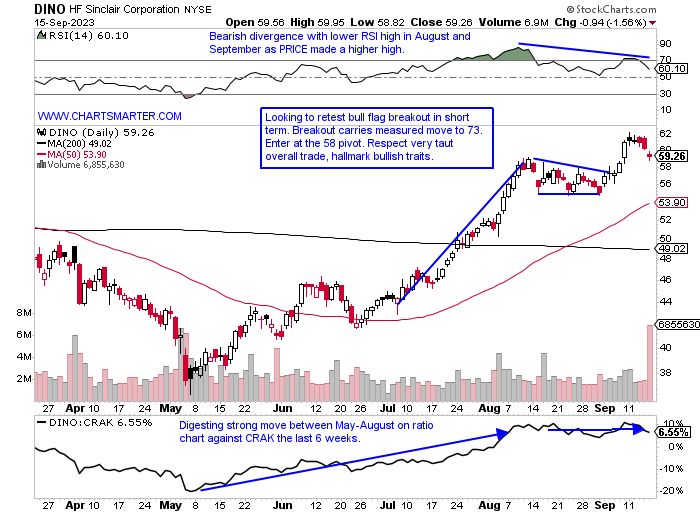
HF Sinclair:
- Refiner play up 14% YTD and 17% over last one year period. Dividend yield of 3%.
- Name 10% off most recent 52-week highs and last week recorded bearish dark cloud cover but still above double bottom with handle base breakout. Consolidating big 4-week win streak weeks ending between 7/21-8/11 that rose a combined 26%.
- Earnings reactions mixed up 2.7 and .6% on 8/3 and 11/7/22 and fell 8.7 and 5.6% on 5/4 and 2/24.
- Enter on pullback into bull flag breakout.
- Entry DINO 58. Stop 55.
Good luck.
This article requires a Chartsmarter membership. Please click here to join.
"The stuff you own ends up owning you." Brad Pitt
Advisors Exposed?
- When prior correlations break down could that be a sign of a major market event? Of course, no one can predict that but the chart below looking at the NAAIM Exposure Index to the S&P 500 shows a glaring disparity. As the NAAIM fell out of bed recently, the S&P 500 maintained its lofty altitude. Is that a sign that the S&P 500 is about to undergo a sizable correction? The last time that NAAIM reached the very round par number in late 2021 we all know what happened to the S&P 500. From the end of 2021 to October 2022 the widely followed benchmark traded from 4800 to 3500. I am not saying this will occur again but it does give another notch in the belt of bears. For those blaming triple witching on the big index declines Friday, the last two examples on 8/18 and 7/21 were precisely UNCH and just one since April fell more than .4%. I still think we are in wait-and-see mode, and no need to take large positions here until a clear direction is seen with markets. After all the S&P 500 has traded the last 2 weeks inside the strong week ending 9/1 that rose 2.5%.
Warning Signs?
- We all know small caps are often good leading indicators, and if that is the case the chart below showing how the IWM and S&P 500 have been traveling down different paths could be worrisome. It could be as simple as the small caps being held hostage by rising interest rates or something more sinister. Over the last one month period as the S&P 500 is UNCH the IWM has declined more than 2%. Will the S&P 500 play catch "down" to the IWM? Of course, no one knows but if the IWM breaks below the bearish head and shoulders pivot of 182, which doubles as 200-day SMA support, there is a good chance it may. Is it too obvious? Perhaps, but that 200 day which acted as resistance in April and May has been support several times since the powerful break above the secular line on 6/2 jumping almost 4%. That has been the strongest gain in 2023 thus far, and if that area should hold the seasonality factors for small caps become very favorable with average gains of better than 5% in October and November, not a typo over the last 4 years. Additionally, it has already lost more this September than its normal 3% already.
Market Implications:
- Looking below the ratio chart of Copper against Gold shows a narrowing range since basically the end of Q1. Market participants like to evaluate this to give an overview of what they think could happen to the benchmarks. Traditionally it is thought of as if Copper is outperforming gold it is a positive sign for the major averages, and vice versa as it would be a defensive look if gold was shining brightly against the Doctor. When tradable instruments start to coil like the one below it is often a harbinger of a very robust move. In the symmetrical triangle, this can break in either direction so watching to see which way this breaks could have a large significance to how this market trades in Q4. Looking at individual copper names SCCO is still my favorite over FCX, as it is just 9% off most recent 52-week highs (FCX is 14% off its own), it is up 32% YTD compared to FCX by just 6% and lastly yields 5% while FCX is .7%. Most importantly the technical look is superior as it sports a good-looking WEEKLY bull flag.
Nuclear Necessities:
- As nuclear power is more and more being embraced with the transition to clean energy, it is confirmed by the PRICE action in many of the instruments that trade. Below is the MONTHLY chart of the URA which displayed excellent follow-through above the bull flag pivot of 22 in August (a measured move to 46 could potentially take a couple of years). So far in September, the volume is about the MONTHLY average with 2 weeks still yet to go. The top holding in the ETF in CCJ (full disclosure I have been long for 6 months) is behaving powerfully although it did record a bearish shooting star candle Friday. But in bull markets, those often are overlooked as the stock powers on. Options activity in the name has also been bullish. Another name in the nuclear space that warrants attention is the utility play in CEG. It has been trending higher in a very smooth fashion, although it did register a bearish engulfing candle. CCJ and CEG have advanced 78 and 27% YTD respectively so far and any pullbacks in the 5-6% range going forward into year-end should be viewed as long opportunities.
"Cracking" Out:
- The refiners have been the best-acting subgroup inside the leading energy sector as seen on the chart below over the last 30 days. The CRAK ETF, which is an illiquid vehicle, is now just 1% off most recent 52-week highs and one can use it simply as a good illustration of how names within are behaving against the drillers and producers. CRAK is higher 11 of the last 12 weeks, and caution may be warranted as last week did break above a WEEKLY bullish ascending triangle, but recorded a doji candle, which is adept at signaling a possible change in the prevailing direction. Notice the weeks ending 6/10/22 and 1/17/23 did register bearish WEEKLY shooting stars. Other groups like the XOP have broken above a bull flag, but have since recorded dubious candlesticks and we know the best breakouts tend to work right away, so perhaps the energy space as a whole needs some time to digest some of their robust advances. That being said each individual stock should be looked at with its own merit and below we take a peek at DK and DINO.
PBF Energy:
- Refiner play up 32% YTD and 87% over last one year period. Dividend yield of 1.5%.
- Name 3% off most recent 52-week highs and excellent relative strength the week ending 9/8 that jumped more than 10% as the CRAK rose 2.6%. And PBF was basically UNCH last week absorbing those lofty gains. Five of the last 6 weeks CLOSED at highs for WEEKLY range.
- Earnings reactions mostly higher up 1.9, 7.5, and 3.5% on 5/5, 2/16, and 10/27/22 before a recent loss of 4.2% on 8/3.
- Enter with buy stop above bull flag.
- Entry PBF 55. Stop 53.
HF Sinclair:
- Refiner play up 14% YTD and 17% over last one year period. Dividend yield of 3%.
- Name 10% off most recent 52-week highs and last week recorded bearish dark cloud cover but still above double bottom with handle base breakout. Consolidating big 4-week win streak weeks ending between 7/21-8/11 that rose a combined 26%.
- Earnings reactions mixed up 2.7 and .6% on 8/3 and 11/7/22 and fell 8.7 and 5.6% on 5/4 and 2/24.
- Enter on pullback into bull flag breakout.
- Entry DINO 58. Stop 55.
Good luck.