"I hope you win the war you tell no one about." -Unknown
The Golden Goose:
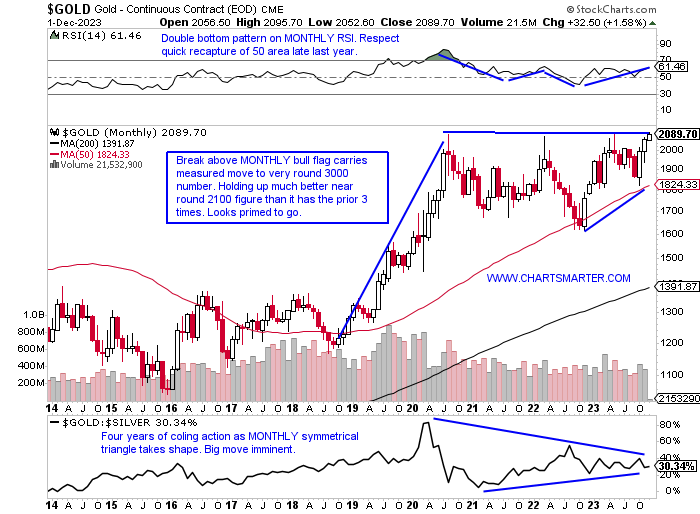
- As equity markets continue their roar higher, gold does not want to be left behind. On the MONTHLY chart below Gold can be seen acting well in October, a tough one for the equity markets and a response many would have thought logical given its traditional "defensive" status. That month gold rose almost 6% and for good measure last month tacked on another 2.2% and in December will go for a rare 3-month win streak (which would be just its second time since early 2020). The reason I am bullish on gold and keep in mind it has a recent correlation to the S&P 500 is the fact that it is not acting jittery at the very round 2000 number as it has in the past. It backed off there with dubious candlesticks with a spinning top in August 2020, a shooting star in March 2022, and back-to-back spinning tops again this April and May. The MONTHLY bull flag below shows a path to the very round 3000 number if it can CLOSE above 2100 on 12/29. Overall notice too how gold bottomed last November with equity benchmarks with a bullish engulfing candle (which ended a 7-month losing streak) at the rising 50 WEEK SMA. It recorded that same candle this October.
Dead Cat Bounce Due?
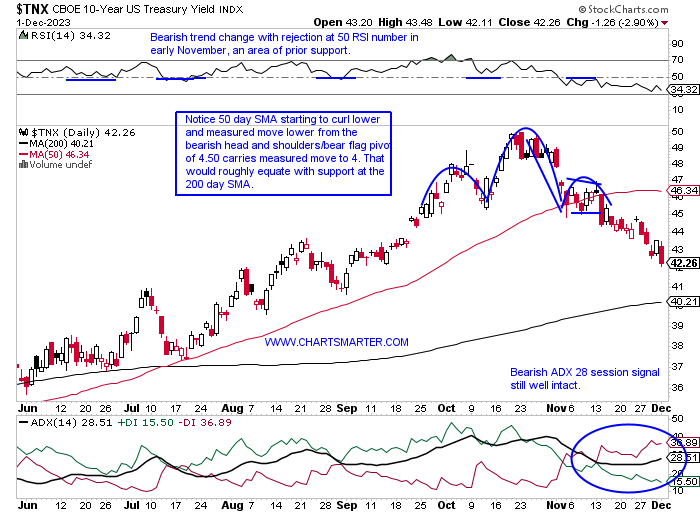
- There is no question that equities have benefitted from the recent demise of the 10-year yield dropping like a rock. But as nothing tends to go up or down in a straight line perhaps a relief bounce is in the cards. If that happens it will be interesting to see how stocks react. It is nearing the 4 area which would be the measured move lower from the bearish head and shoulders breakdown/bear flag at the 4.5 level. On its WEEKLY chart, (this is the chart I wrote one month ago) I have stated I believe a retest back to the double bottom breakout at 4.1 made sense. This would all align with a touch of the still upward-sloping 200-day SMA too. Downward pressure is still strong and that was recently highlighted with the TNX not showing any life as it filled in a gap from the 9/20 session and has continued lower. This instrument still feels heavy as it has fallen 4 of the last 6 weeks with all four CLOSING right at lows for the WEEKLY range and bulls were nowhere to be found after the week ending 11/24 recorded a doji candle.
Viva Brazil:
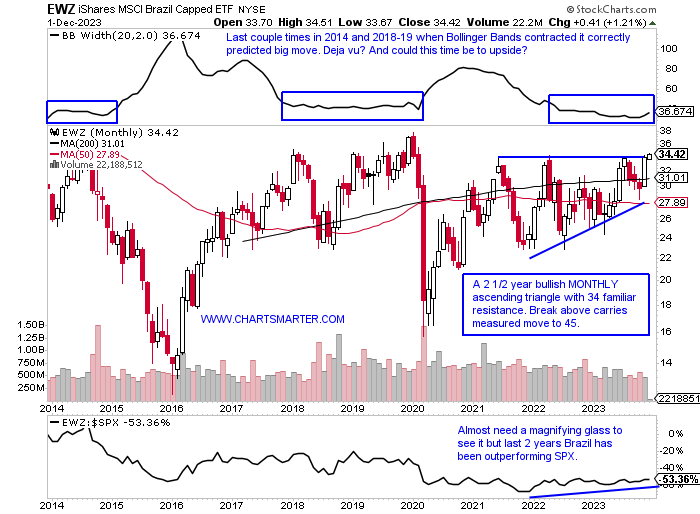
- As there seems to be a lot going on in South America with the Argentine elections, now there is a build-up of troops in Venezuela one region looks poised for further gains. The MONTHLY chart below of the EWZ looks like it wants higher PRICES as it sits right at a sticky 34 resistance area within a bullish ascending triangle. Last month it jumped more than 13% and if December can CLOSE above 34 it would carry a measured move to 45. Notice the Bollinger Band width at the top of the chart is contracting indicating a big possible move (the last 2 resolved lower). Of course, if commodities can get going that would be a big help as it is a resource-rich nation, but one caveat may be the US dollar bottoming. I took a profit on a decent short on Friday after the completion of a bullish morning star pattern on Thursday. Last week it also touched the oversold 30 RSI number and the last time that occurred in mid-July it began a powerful move higher.
Biotech Bonanza:
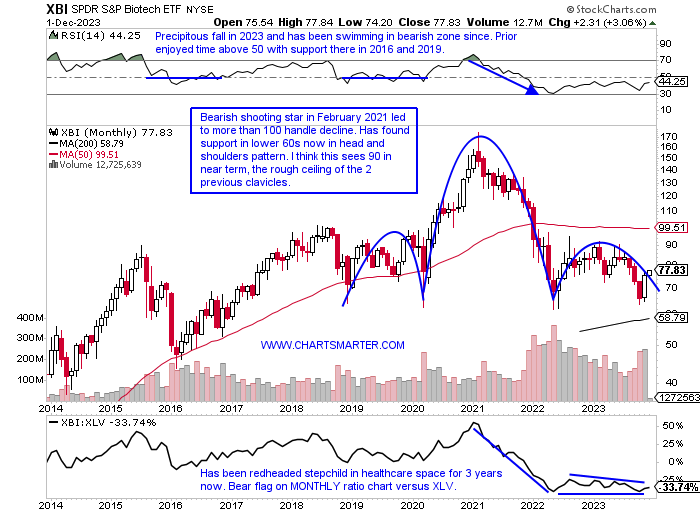
- On a YTD basis healthcare, via the XLV, has been pretty close to the cellar, as it is just one of four major S&P sectors in the red down 2%. If we drill down a bit more we see biotech has been the biggest culprit within as the group as the XBI is off more than 6% thus far in 2023. The MONTHLY chart below shows that it did what it needed to do by holding support in the lower 60s, a familiar area of support now four times dating back to December 2018 as that it where the bearish head and shoulders formation commenced. Last month the XBI jumped more than 14%, its best MONTHLY return in years and if it can break above the bearish pattern here we know from FALSE moves come fast ones in the opposite direction. A good way to gauge "risk on" in the space is the ratio chart here comparing the "youthful" names in the XBI, to the more "mature" IBB plays and once this overall rally took hold in late October it has been all about the XBI. Two of my favorite plays with include NBIX and IONS, which now trade 8 and 1% off their respective 52 week highs as the XBI is 16% off its annual peak.
"Banking" On Gains:
- The overall markets have been ignoring plenty of headlines recently. We have had Moodys lowering its outlook on the US. We have had strategists like Mike Wilson and let's not forget Marko Kolanovic from JPM which in early October called for a 20% market plunge. Reports of CTA's covering the largest amount of stock in years had many declaring the big rally was just a short squeeze. I could go on and on but the market for the time being is looking past all this and the financials over the last month period when this surge roughly began have been one of the biggest beneficiaries with the XLF up 11%. The ETF is on a 5-week winning streak, with all 5 CLOSING at the top of the WEEKLY range, and the week ending 11/3 which kicked off the splurge saw it record one of the biggest advances with a gain of 7.4%, outshining both the S&P 500 and Nasdaq. The daily chart below shows the impressive double-bottom breakout and the MONTHLY chart sees the trade between the round 30-40 numbers and notice how it has a tendency to keep progressing higher after big MONTHLY gains. Let us look at two attractive names in the space too with GS and MC.
Goldman Sachs:
- Capital markets play up 1% YTD and down 9% over last one year period. Dividend yield of 3.2%.
- Name 9% off most recent 52 week highs and up 3 of last 5 weeks with all five CLOSING at highs for the WEEKLY range. Three WEEKLY advances were powerful with 2 decliners very small ranges showing sellers strike. Add on above WEEKLY double bottom pivot of 355.81.
- Earnings reactions mostly lower off 1.6, 1.7, and 6.4% on 10/17, 4/18, and 1/17 and rose 1% on 7/18.
- Enter after bull flag breakout.
- Entry GS here. Stop 335.
Moelis:
- Capital markets plasy up 28% YTD and 14% over last one year period. Dividend yield of 2.4%.
- Name 6% off most recent 52 week highs and tremendous relative strength this week up better than 9% with the XLF and IAI up 2.2 and 2.8% respectively. WEEKLY CLOSE above 50 should see quick move to 65 out of cup with handle base.
- FOUR straight negative earnings reactions down .9, 7.9, 7.9, and 7% on 11/3, 7/27, 4/27 and 2/9.
- Enter after break above double bottom pattern.
- Entry MC here. Stop 46.75.
This article requires a Chartsmarter membership. Please click here to join.
"I hope you win the war you tell no one about." -Unknown
The Golden Goose:
- As equity markets continue their roar higher, gold does not want to be left behind. On the MONTHLY chart below Gold can be seen acting well in October, a tough one for the equity markets and a response many would have thought logical given its traditional "defensive" status. That month gold rose almost 6% and for good measure last month tacked on another 2.2% and in December will go for a rare 3-month win streak (which would be just its second time since early 2020). The reason I am bullish on gold and keep in mind it has a recent correlation to the S&P 500 is the fact that it is not acting jittery at the very round 2000 number as it has in the past. It backed off there with dubious candlesticks with a spinning top in August 2020, a shooting star in March 2022, and back-to-back spinning tops again this April and May. The MONTHLY bull flag below shows a path to the very round 3000 number if it can CLOSE above 2100 on 12/29. Overall notice too how gold bottomed last November with equity benchmarks with a bullish engulfing candle (which ended a 7-month losing streak) at the rising 50 WEEK SMA. It recorded that same candle this October.
Dead Cat Bounce Due?
- There is no question that equities have benefitted from the recent demise of the 10-year yield dropping like a rock. But as nothing tends to go up or down in a straight line perhaps a relief bounce is in the cards. If that happens it will be interesting to see how stocks react. It is nearing the 4 area which would be the measured move lower from the bearish head and shoulders breakdown/bear flag at the 4.5 level. On its WEEKLY chart, (this is the chart I wrote one month ago) I have stated I believe a retest back to the double bottom breakout at 4.1 made sense. This would all align with a touch of the still upward-sloping 200-day SMA too. Downward pressure is still strong and that was recently highlighted with the TNX not showing any life as it filled in a gap from the 9/20 session and has continued lower. This instrument still feels heavy as it has fallen 4 of the last 6 weeks with all four CLOSING right at lows for the WEEKLY range and bulls were nowhere to be found after the week ending 11/24 recorded a doji candle.
Viva Brazil:
- As there seems to be a lot going on in South America with the Argentine elections, now there is a build-up of troops in Venezuela one region looks poised for further gains. The MONTHLY chart below of the EWZ looks like it wants higher PRICES as it sits right at a sticky 34 resistance area within a bullish ascending triangle. Last month it jumped more than 13% and if December can CLOSE above 34 it would carry a measured move to 45. Notice the Bollinger Band width at the top of the chart is contracting indicating a big possible move (the last 2 resolved lower). Of course, if commodities can get going that would be a big help as it is a resource-rich nation, but one caveat may be the US dollar bottoming. I took a profit on a decent short on Friday after the completion of a bullish morning star pattern on Thursday. Last week it also touched the oversold 30 RSI number and the last time that occurred in mid-July it began a powerful move higher.
Biotech Bonanza:
- On a YTD basis healthcare, via the XLV, has been pretty close to the cellar, as it is just one of four major S&P sectors in the red down 2%. If we drill down a bit more we see biotech has been the biggest culprit within as the group as the XBI is off more than 6% thus far in 2023. The MONTHLY chart below shows that it did what it needed to do by holding support in the lower 60s, a familiar area of support now four times dating back to December 2018 as that it where the bearish head and shoulders formation commenced. Last month the XBI jumped more than 14%, its best MONTHLY return in years and if it can break above the bearish pattern here we know from FALSE moves come fast ones in the opposite direction. A good way to gauge "risk on" in the space is the ratio chart here comparing the "youthful" names in the XBI, to the more "mature" IBB plays and once this overall rally took hold in late October it has been all about the XBI. Two of my favorite plays with include NBIX and IONS, which now trade 8 and 1% off their respective 52 week highs as the XBI is 16% off its annual peak.
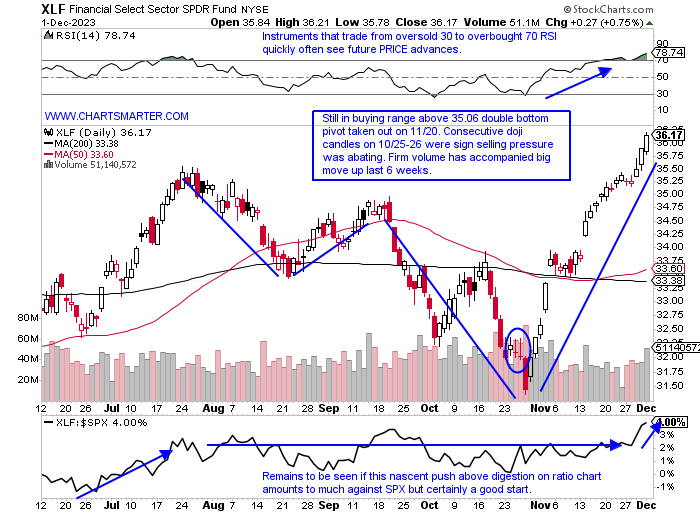
"Banking" On Gains:
- The overall markets have been ignoring plenty of headlines recently. We have had Moodys lowering its outlook on the US. We have had strategists like Mike Wilson and let's not forget Marko Kolanovic from JPM which in early October called for a 20% market plunge. Reports of CTA's covering the largest amount of stock in years had many declaring the big rally was just a short squeeze. I could go on and on but the market for the time being is looking past all this and the financials over the last month period when this surge roughly began have been one of the biggest beneficiaries with the XLF up 11%. The ETF is on a 5-week winning streak, with all 5 CLOSING at the top of the WEEKLY range, and the week ending 11/3 which kicked off the splurge saw it record one of the biggest advances with a gain of 7.4%, outshining both the S&P 500 and Nasdaq. The daily chart below shows the impressive double-bottom breakout and the MONTHLY chart sees the trade between the round 30-40 numbers and notice how it has a tendency to keep progressing higher after big MONTHLY gains. Let us look at two attractive names in the space too with GS and MC.
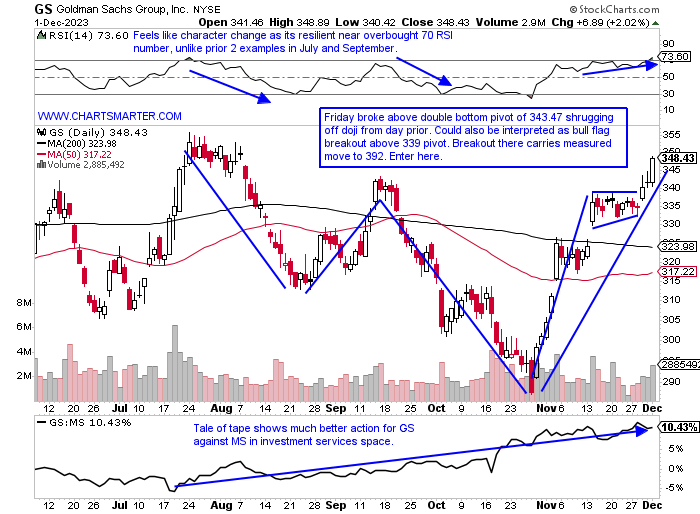
Goldman Sachs:
- Capital markets play up 1% YTD and down 9% over last one year period. Dividend yield of 3.2%.
- Name 9% off most recent 52 week highs and up 3 of last 5 weeks with all five CLOSING at highs for the WEEKLY range. Three WEEKLY advances were powerful with 2 decliners very small ranges showing sellers strike. Add on above WEEKLY double bottom pivot of 355.81.
- Earnings reactions mostly lower off 1.6, 1.7, and 6.4% on 10/17, 4/18, and 1/17 and rose 1% on 7/18.
- Enter after bull flag breakout.
- Entry GS here. Stop 335.
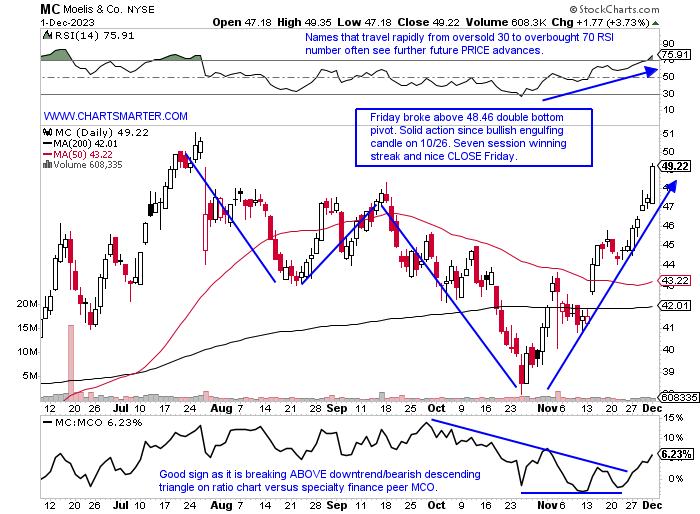
Moelis:
- Capital markets plasy up 28% YTD and 14% over last one year period. Dividend yield of 2.4%.
- Name 6% off most recent 52 week highs and tremendous relative strength this week up better than 9% with the XLF and IAI up 2.2 and 2.8% respectively. WEEKLY CLOSE above 50 should see quick move to 65 out of cup with handle base.
- FOUR straight negative earnings reactions down .9, 7.9, 7.9, and 7% on 11/3, 7/27, 4/27 and 2/9.
- Enter after break above double bottom pattern.
- Entry MC here. Stop 46.75.