"Perhaps the worst will happen, perhaps not, until then, look forward to better things." - Seneca
"Value" Showing the Way:
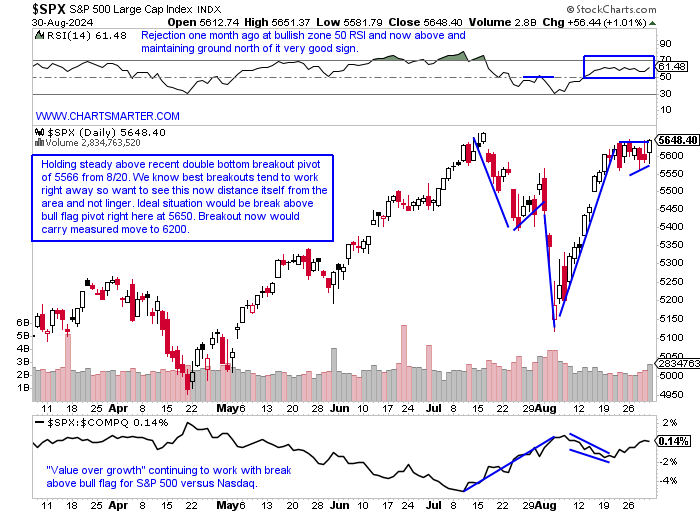
- It is no secret that on a YTD basis "value" has been outshining growth, and it may gain steam after the earnings miss by NVDA as that will likely need some time to recover. Taking a peak at the ratio chart comparing value to growth via the ratio chart of the VTV to the VUG it shows the former in firm control. This is not a new phenomenon as over the last 6 months this has been happening with a few short hiccups along the way. Peering at the action of the major 11 S&P sectors so far in 2024 it has been dominated by the likes of the financials, utilities, staples, and healthcare. The daily chart below of the S&P 500 shows solid PRICE action with an excellent CLOSE as August is now in the rearview mirror. Additional confirmation of the value over growth theme comes from the S&P 500 over Nasdaq ratio chart too. PRICE which is omnipotent is just below a bull flag pivot, which is not giving up any ground following the recent double-bottom breakout. To balance the very sanguine view, seasonality is not favorable in September (over the last 4 years it has not once CLOSED above where it started with an average loss of almost 6%) and the S&P 500 WEEKLY chart did record the dreadful doji candle last week.
Dollar Dilemma:
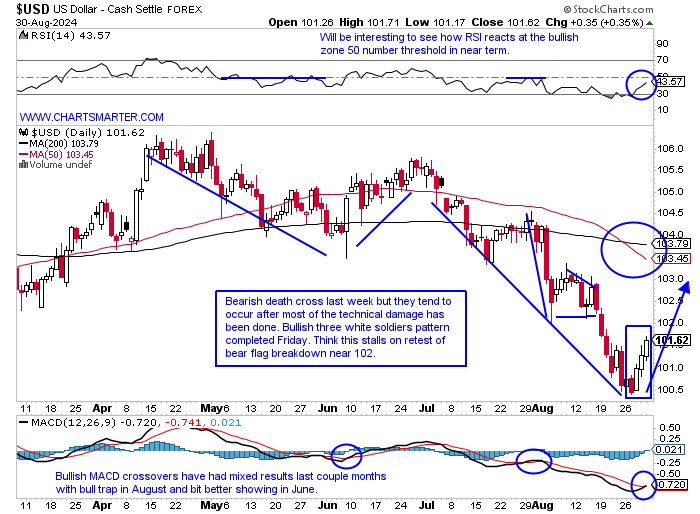
- Commodities came under pressure late last week as the greenback found its footing. The daily chart below of the US Dollar shows round number theory coming into play with the bullish engulfing candle Tuesday igniting a swift run from the 100 level. The big question remains is it a dead cat bounce or the start of something better? My feeling is that this will stall near 102 next week if it gets there, the rough area of a prior bear flag breakdown, which coincidentally reached its measured move to the par number. Notice on its WEEKLY chart it touched the oversold 30 RSI level for the first time in more than 2 years, the ADX line (black) was showing positive divergence as it rose in July while PRICE was still declining, and it recorded a bullish harami candle off the 200 WEEK SMA (last WEEKLY harami candle in July 2023 started a 10 of 11 week win streak). One must always be open-minded to any possible scenario, but the trend is still lower with bears in control. That can quickly change with another constructive week to start September.
Doctor Appointment:
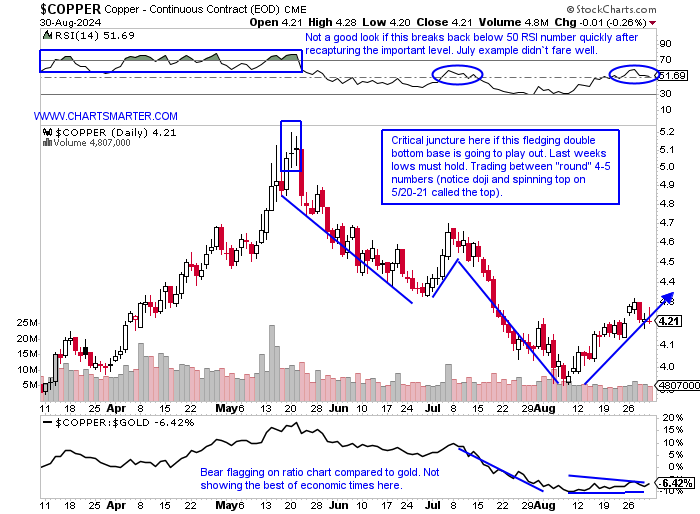
- Copper has been called "Doctor" as it can give a good indication of the genuine health of the economy. With the industrial metal now 20% off highs since a doji candle in late May it may need some prescriptions. Friday did record another doji candle after a run of 10% advance from just below the 4 number so perhaps some rest is what the doctor would order here. Candles on the WEEKLY chart would have been very helpful with the top coming with a bearish dark cloud cover the week ending 5/24 and the week ending 8/16 calling a near-term low with a bullish engulfing candle. If one was to venture into the individual stock space I would favor SCCO over FCX. It is up 20% YTD, compared to FCX higher by 4%, and carries a dividend yield of 2.3% while FCX pays .7%. One can see the outperformance on the ratio chart between the two and Friday recorded a dragonfly doji candle right at the very round par number as a double-bottom pattern potentially takes shape.
Natty Bottoming?
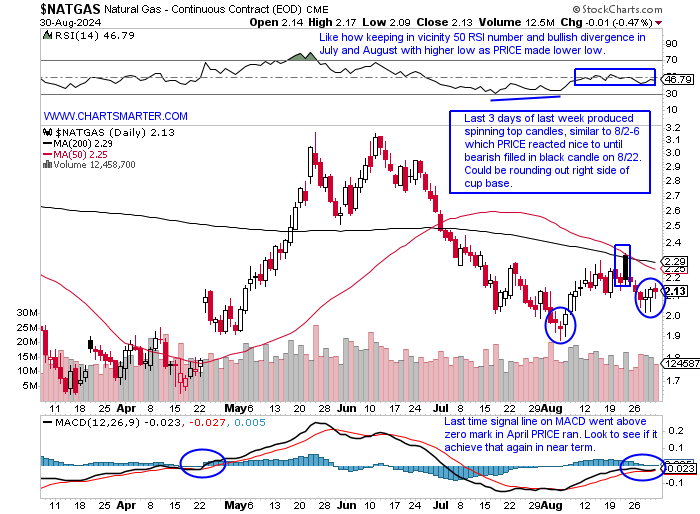
- As many focus on other commodities natural gas may quietly be putting in a near-term low. The daily chart below shows it trading roughly between the "round" 2 and 3 numbers since Q2. It is obviously at the lower end of that range and still swimming below both the downward-sloping 50 and 200-day SMAs but last week produced some bottoming candles. Could it be rounding out the right side of a cup base? Its WEEKLY chart also has work to do as it has declined 9 of the last 12 weeks, although if the recent lows hold a bullish inverse head and shoulders pattern is taking shape. For that possibility to remain valid the lows of the bullish engulfing candle the week ending 8/9 must hold. The MONTHLY chart registered a spinning top candle in August, known for signaling selling pressure abating, and it has advanced 4 of the last 5 months starting with the bullish engulfing candle in April. Notice the double bottom at 1.50 from the COVID lows and this February after a huge drawdown from the very round 10 number in August 2022. This is not for the faint of heart and they call it the widow maker for a reason.
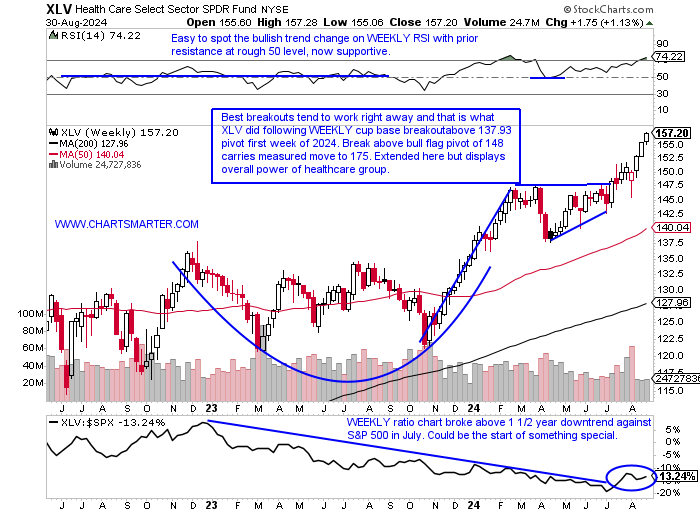
Healthcare Hearty:
- Healthcare is a well-followed sector for its diversity and has something for both growth and conservative investors alike. Part of the allure is the mature dividend-paying pharma names or healthcare providers. On the other hand, biotech can satisfy those craving some risk. Then of course there are the medical equipment and supply groups. The WEEKLY chart below of the XLV combines all of the above and the ETF is on a roll. It is on a 3-week win streak following the bullish hammer candle from the week ending 8/9 that successfully retested the bull flag breakout. The last 4 weeks have all CLOSED at highs for the WEEKLY range, a very bullish trait. Looking at the MONTHLY XBI chart from our healthcare note this past week it did manage its first CLOSE above its 50-MONTH SMA for the first time in more than 2 1/2 years. The daily chart is holding above par well but Friday recorded a doji candle. I still think this resolves much higher into year-end. Even the device plays, via the IHI, that have been lagging the overall healthcare space managed to carve out a handle on its double bottom base with a pivot of 59.15.
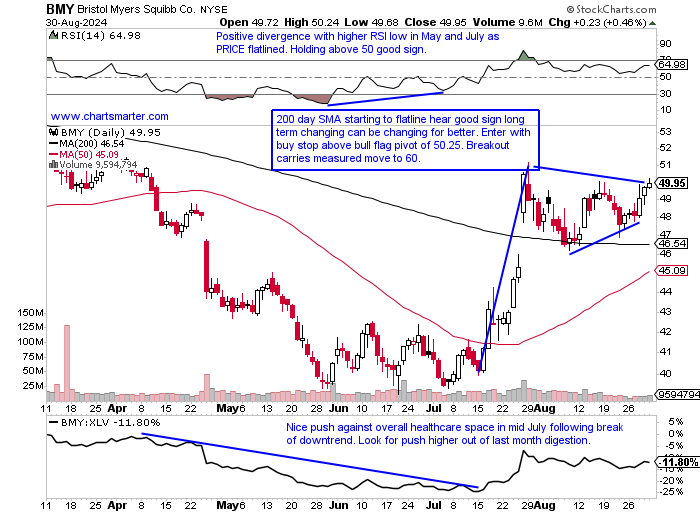
Bristol Meyers:
- Healthcare giant down 3% YTD and 19% over last one year period. Dividend yield of 4.8%.
- Name 20% off most recent 52 week highs and WEEKLY chart shows trade between round 40-50 numbers and notice just before WEEKLY bull flag recorded a doji cand bullish hammer candle which should have signaled selling pressure was abating and shorts should have been bought back. Nice recent digestion of combined 23% gain weeks ending 7/19-26.
- Earnings reactions mixed up 11.4 and .1% on 7/26 and 2/2 and fell 8.5 and 6.4% on 4/25 and 10/26/23.
- Enter with buy stop above bull flag.
- Entry BMY 50.25. Stop 48.
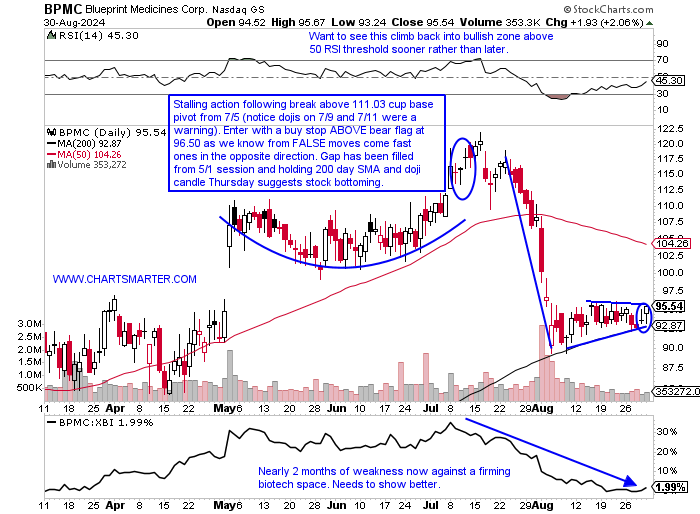
Blueprint Medicines:
- Biotech play up 4% YTD and 92% over last one year period.
- Name 22% off most recent 52-week highs and WEEKLY chart shows 4 taut CLOSES in a row following the 19% combined move lower during 3-week losing streak weeks ending between 7/19-8/2. Sellers vanishing. What a MONTHLY signal the gravestone doji was in July.
- Earnings reactions mostly higher up 12.8, 14, and 25.6% on 5/2, 2/15, and 10/26/23 before a loss of 7.4% on 8/1.
- Enter with buy stop ABOVE bear flag.
- Entry BPMC 96.50. Stop 92.
This article requires a Chartsmarter membership. Please click here to join.
"Perhaps the worst will happen, perhaps not, until then, look forward to better things." - Seneca
"Value" Showing the Way:
- It is no secret that on a YTD basis "value" has been outshining growth, and it may gain steam after the earnings miss by NVDA as that will likely need some time to recover. Taking a peak at the ratio chart comparing value to growth via the ratio chart of the VTV to the VUG it shows the former in firm control. This is not a new phenomenon as over the last 6 months this has been happening with a few short hiccups along the way. Peering at the action of the major 11 S&P sectors so far in 2024 it has been dominated by the likes of the financials, utilities, staples, and healthcare. The daily chart below of the S&P 500 shows solid PRICE action with an excellent CLOSE as August is now in the rearview mirror. Additional confirmation of the value over growth theme comes from the S&P 500 over Nasdaq ratio chart too. PRICE which is omnipotent is just below a bull flag pivot, which is not giving up any ground following the recent double-bottom breakout. To balance the very sanguine view, seasonality is not favorable in September (over the last 4 years it has not once CLOSED above where it started with an average loss of almost 6%) and the S&P 500 WEEKLY chart did record the dreadful doji candle last week.
Dollar Dilemma:
- Commodities came under pressure late last week as the greenback found its footing. The daily chart below of the US Dollar shows round number theory coming into play with the bullish engulfing candle Tuesday igniting a swift run from the 100 level. The big question remains is it a dead cat bounce or the start of something better? My feeling is that this will stall near 102 next week if it gets there, the rough area of a prior bear flag breakdown, which coincidentally reached its measured move to the par number. Notice on its WEEKLY chart it touched the oversold 30 RSI level for the first time in more than 2 years, the ADX line (black) was showing positive divergence as it rose in July while PRICE was still declining, and it recorded a bullish harami candle off the 200 WEEK SMA (last WEEKLY harami candle in July 2023 started a 10 of 11 week win streak). One must always be open-minded to any possible scenario, but the trend is still lower with bears in control. That can quickly change with another constructive week to start September.
Doctor Appointment:
- Copper has been called "Doctor" as it can give a good indication of the genuine health of the economy. With the industrial metal now 20% off highs since a doji candle in late May it may need some prescriptions. Friday did record another doji candle after a run of 10% advance from just below the 4 number so perhaps some rest is what the doctor would order here. Candles on the WEEKLY chart would have been very helpful with the top coming with a bearish dark cloud cover the week ending 5/24 and the week ending 8/16 calling a near-term low with a bullish engulfing candle. If one was to venture into the individual stock space I would favor SCCO over FCX. It is up 20% YTD, compared to FCX higher by 4%, and carries a dividend yield of 2.3% while FCX pays .7%. One can see the outperformance on the ratio chart between the two and Friday recorded a dragonfly doji candle right at the very round par number as a double-bottom pattern potentially takes shape.
Natty Bottoming?
- As many focus on other commodities natural gas may quietly be putting in a near-term low. The daily chart below shows it trading roughly between the "round" 2 and 3 numbers since Q2. It is obviously at the lower end of that range and still swimming below both the downward-sloping 50 and 200-day SMAs but last week produced some bottoming candles. Could it be rounding out the right side of a cup base? Its WEEKLY chart also has work to do as it has declined 9 of the last 12 weeks, although if the recent lows hold a bullish inverse head and shoulders pattern is taking shape. For that possibility to remain valid the lows of the bullish engulfing candle the week ending 8/9 must hold. The MONTHLY chart registered a spinning top candle in August, known for signaling selling pressure abating, and it has advanced 4 of the last 5 months starting with the bullish engulfing candle in April. Notice the double bottom at 1.50 from the COVID lows and this February after a huge drawdown from the very round 10 number in August 2022. This is not for the faint of heart and they call it the widow maker for a reason.
Healthcare Hearty:
- Healthcare is a well-followed sector for its diversity and has something for both growth and conservative investors alike. Part of the allure is the mature dividend-paying pharma names or healthcare providers. On the other hand, biotech can satisfy those craving some risk. Then of course there are the medical equipment and supply groups. The WEEKLY chart below of the XLV combines all of the above and the ETF is on a roll. It is on a 3-week win streak following the bullish hammer candle from the week ending 8/9 that successfully retested the bull flag breakout. The last 4 weeks have all CLOSED at highs for the WEEKLY range, a very bullish trait. Looking at the MONTHLY XBI chart from our healthcare note this past week it did manage its first CLOSE above its 50-MONTH SMA for the first time in more than 2 1/2 years. The daily chart is holding above par well but Friday recorded a doji candle. I still think this resolves much higher into year-end. Even the device plays, via the IHI, that have been lagging the overall healthcare space managed to carve out a handle on its double bottom base with a pivot of 59.15.
Bristol Meyers:
- Healthcare giant down 3% YTD and 19% over last one year period. Dividend yield of 4.8%.
- Name 20% off most recent 52 week highs and WEEKLY chart shows trade between round 40-50 numbers and notice just before WEEKLY bull flag recorded a doji cand bullish hammer candle which should have signaled selling pressure was abating and shorts should have been bought back. Nice recent digestion of combined 23% gain weeks ending 7/19-26.
- Earnings reactions mixed up 11.4 and .1% on 7/26 and 2/2 and fell 8.5 and 6.4% on 4/25 and 10/26/23.
- Enter with buy stop above bull flag.
- Entry BMY 50.25. Stop 48.
Blueprint Medicines:
- Biotech play up 4% YTD and 92% over last one year period.
- Name 22% off most recent 52-week highs and WEEKLY chart shows 4 taut CLOSES in a row following the 19% combined move lower during 3-week losing streak weeks ending between 7/19-8/2. Sellers vanishing. What a MONTHLY signal the gravestone doji was in July.
- Earnings reactions mostly higher up 12.8, 14, and 25.6% on 5/2, 2/15, and 10/26/23 before a loss of 7.4% on 8/1.
- Enter with buy stop ABOVE bear flag.
- Entry BPMC 96.50. Stop 92.